2015 SMARTER Program Project Archive
Project 1: Implementation and Actuation of a Fish Replica to Study Schooling in Danio rerio
Teachers: Brian Lam and Horace Walcott, Mentor: Dr. Maurizio Porfiri, Research Collaborator: Violet Mwaffo
Research
Title: Implementation and Actuation of a Fish Replica to Study Schooling in Danio rerio
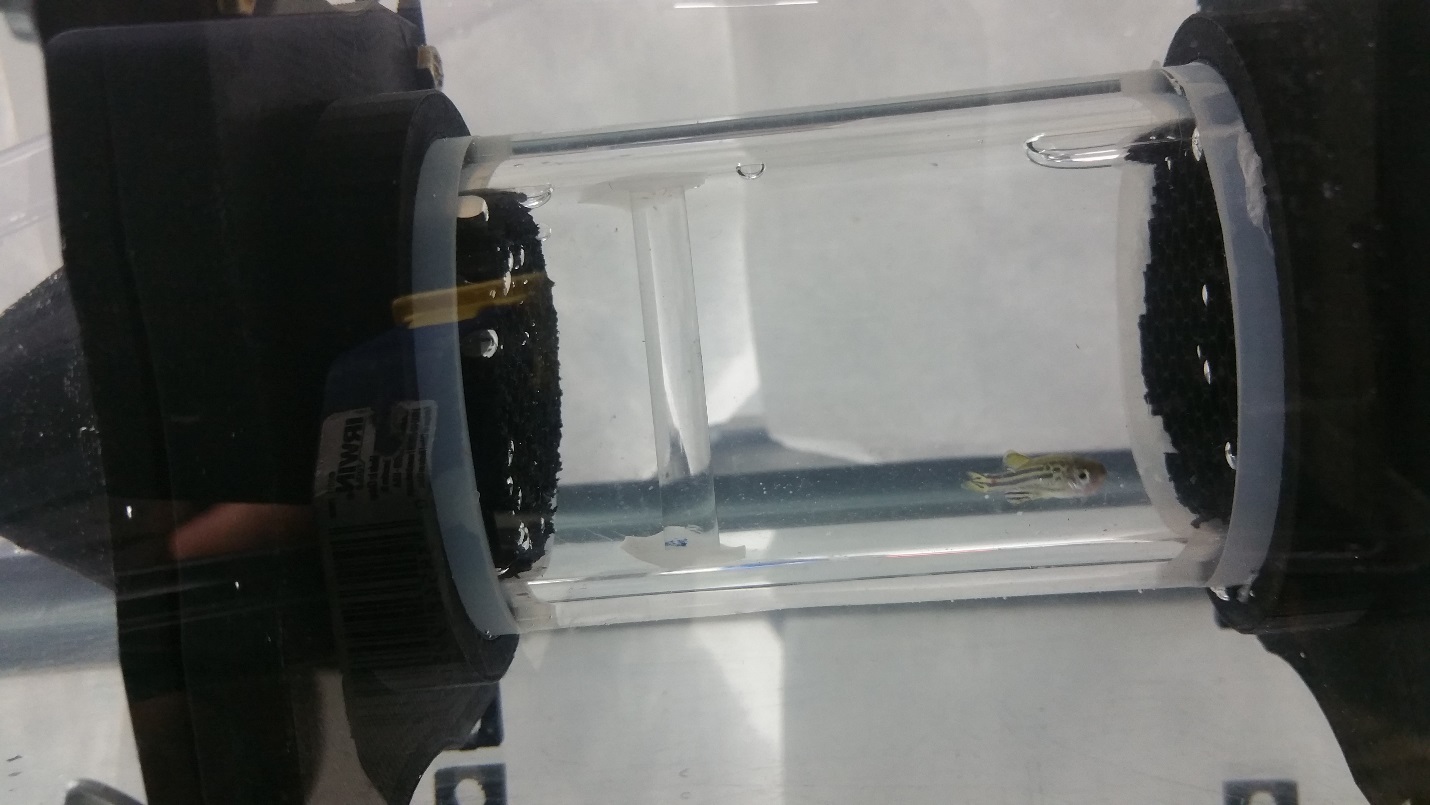
The zebrafish (Danio rerio) is commonly used as an experimental subject due to its well understood genome and rapid embryonic development in the laboratory setting. These animals exhibit shoaling or schooling in nature, in which the follower fish are thought to maintain hydrodynamic efficiency by swimming in the wake of a leader fish. This experiment examines the response of a single live zebra fish swimming in a flow chamber behind a replica fish at varying flow rates. Replica fish are molded from silicone or lurecraft polymer, the molds for which are 3D printed. The tail of the replica fish is actuated using one of two methods with a frequency and maximum amplitude typical of wild type zebrafish. The tail may be oscillated using an Arduino controlled servomotor or by neodymium magnets embedded in the replica tail in conjunction with electromagnets positioned around the flow chamber. Video of the live fish body is taken and analyzed using MATLAB and ProAnalyst software to monitor the biomotive response in and around the wake of the replica.
Figure: Live zebrafish resting in the flow test chamber
Lesson Plan
Title: Applications of Boyle's Law and Bernoulli's Equation in a Cartesian Diver and Blowpipe
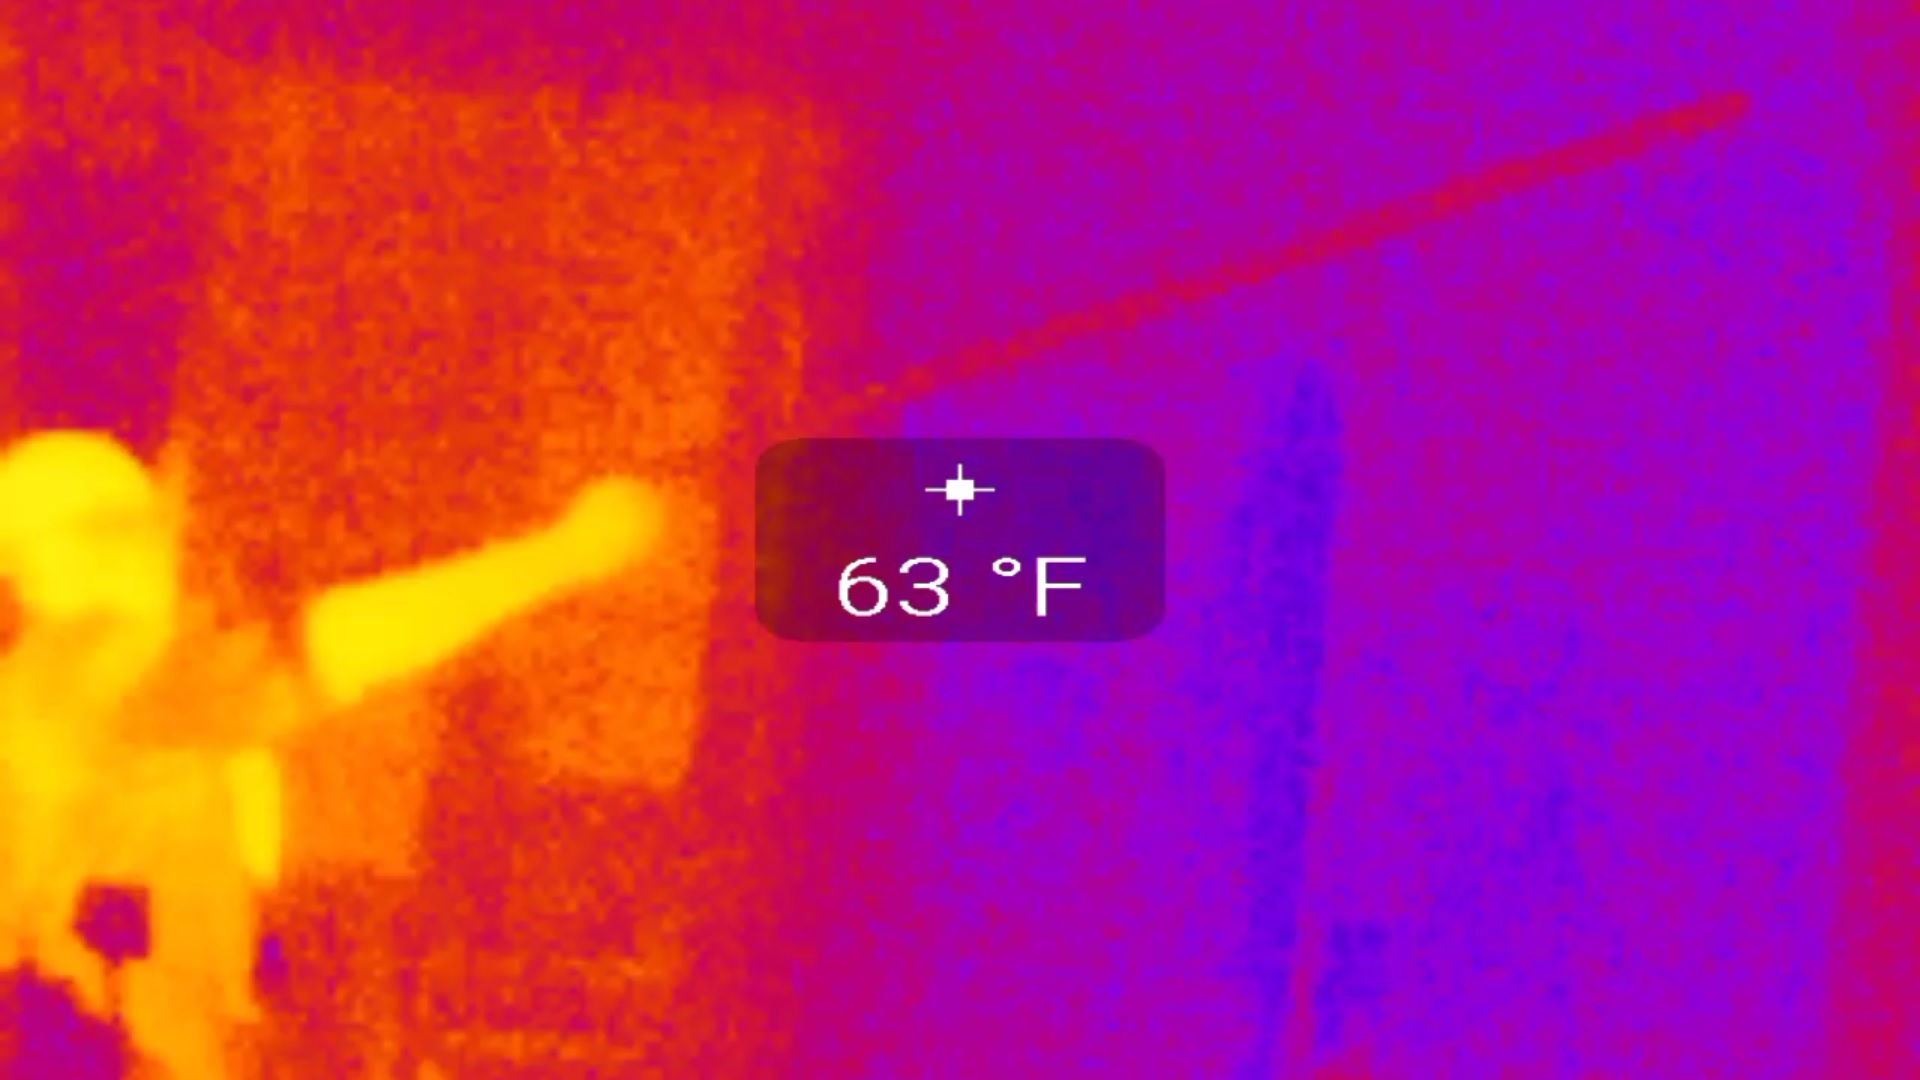
Students will review the principles of pressure and Boyle’s law to design both a cartesian diver setup and a simple blowpipe. Students will create posters with diagrams explaining the changes in pressure in their devices and how changes in pressure affect the diver and the dart in the blowpipe. Bernoulli’s equation will be introduced to the students as an extension from the Regents curriculum, and a cross sectional view of an airplane wing will be used as a motivation for this section of the lesson. Drawing from both their prior knowledge of gas laws and their new understandings of Bernoulli’s equation, students will predict the temperature effects of the fluid in their blowpipes and cartesian divers. Finally, thermal imaging cameras will be used to verify their predictions, and the results will be added to the posters.
Figure: Thermal image of a blowpipe in use.
Project 2: Making Things Talk in the Physical World with the Use of Augmented Reality
Teachers: Phil Cook and Iulian Irimina Mentor: Dr. Vikram Kapila, Research Collaborator: Jared A. Frank
Research
Title: Making Things Talk in the Physical World with the Use of Augmented Reality
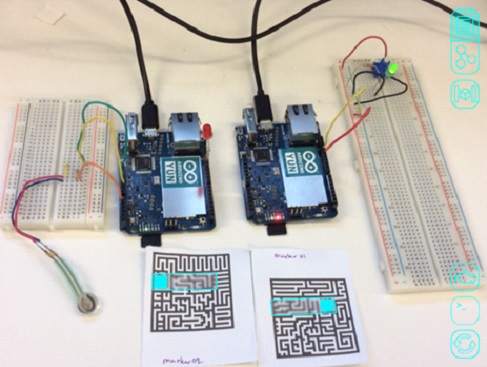
Our research focused on creating interactions of physical things with the help of augmented reality. By using augmented reality we created functionality at the physical level between things that otherwise would communicate independent of each other. In our experiment, a regular LED, an RGB-LED, a flex sensor, and a temperature sensor communicated according to user-designed interactions on an app. We used two Arduino Yun microcontrollers as hybrid objects to communicate with a server and our iOS app. We customized a virtual user-interface for the user to interact with the app and connect the interface with physical objects that we had interfaced with and programmed using Arduino. To accomplish our goals, we used a computer, Wifi, Arduino Yun, a microSD card, a micro USB cable, breadboard, various sensors and actuators, and jumper wires. On the software side, we used the Open Hybrid platform, Hybrid Editor software on IOS, HTML editor, and Arduino software.
Figure: Illustrative test-bed for augmented reality based interaction with physical objects
Lesson Plan
Title: Developing and Testing a Conductivity Probe with Arduino
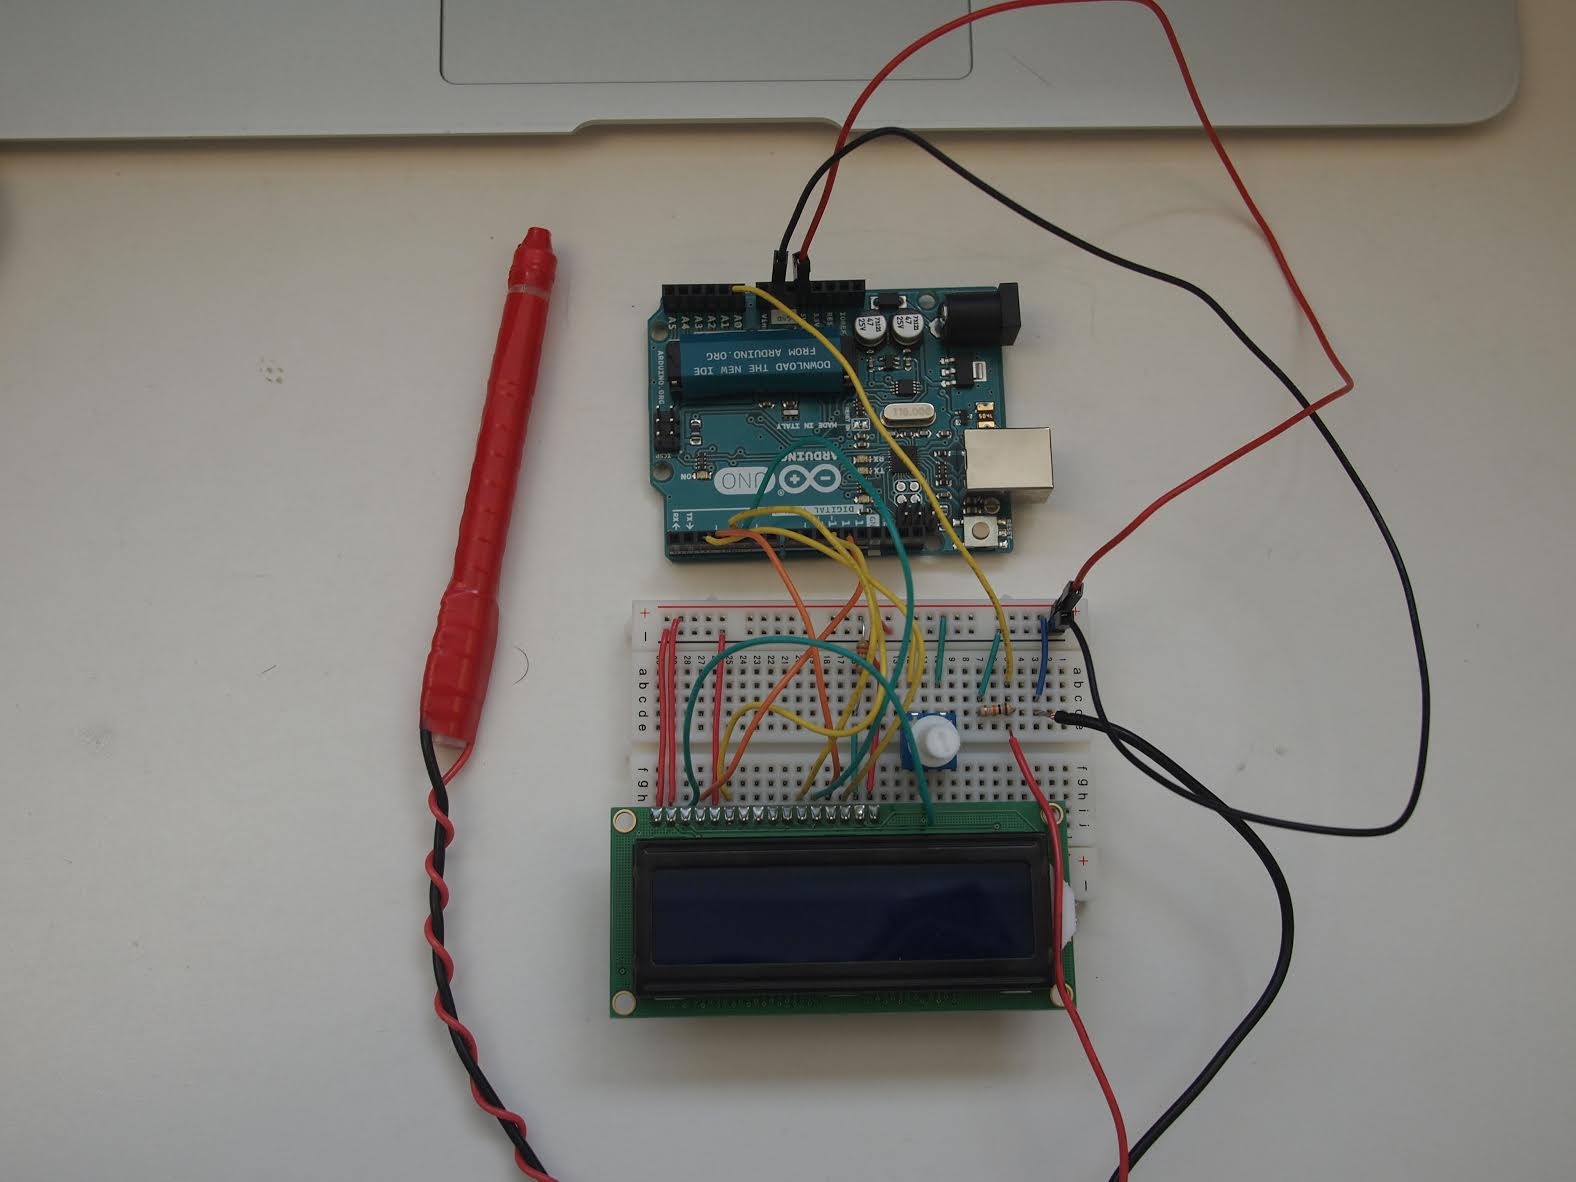
In this activity, students construct a simple conductivity probe and then integrate the probe into two different circuits to test the behavior of the probe in solutions of varying conductivity. The focus is to introduce students to the construction of a conductivity probe and expose them to several different ways of integrating the probe to obtain qualitative and quantitative measurements.
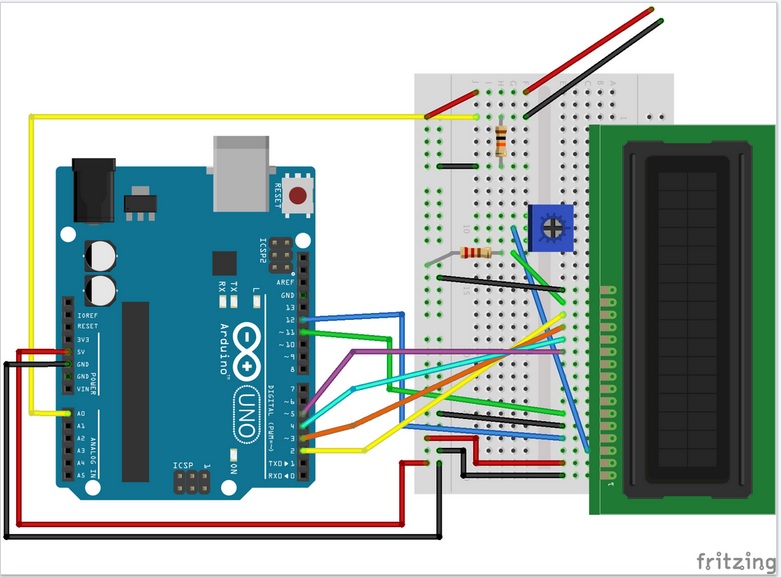
Figure: Conductivity probe connected to the Arduino
Figure: The LCD is attached to the Arduino to show the values of the experiment
Project 3: Measuring Energy Expenditure in a Robotic Arm to Determine Optimal Trajectory
Teachers: Ramona Fittipaldi and Marc Frank, Mentor: Dr. Joo Kim, Research Collaborator: Henry M. Clever
Research
Title: Measuring Energy Expenditure in a Robotic Arm to Determine Optimal Trajectory
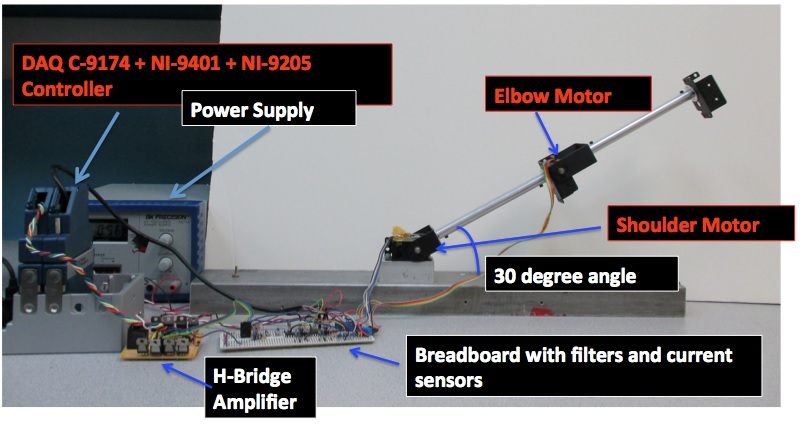
This research addresses the challenges of creating the optimal trajectory of a robotic arm. Our research lab is comparing robots and humans’ energy expenditure. Robotic arms depend on mechanical power and heat in a circuit (see Figure) while human arms depend on mechanical power and the heat generated by the arm’s muscles as well as the basal metabolic rate (resting rate expenditure). Understanding energy expenditure in both humans and robots is essential for optimizing energy usage. Knowledge of most efficient trajectories can be applied to many industries to reduce energy usage in robotic systems. In this experiment, 18 static tests and 25 dynamic tests were performed on a 2-DOF robotic arm, consisting of an elbow and a shoulder, to calculate current, voltage, power, and energy. The static tests were at different angles ranging from 5° to 90° in increments of 5°. The dynamic tests included five trajectories at five different speeds for each path. The test results are useful to our research lab because they can be applied to a least squares algorithm to mathematically predict an optimal trajectory in a robotic system. The methodology, results, and discussion in greater details of these tests are documented in the full report.
Figure: Hardware for the experiment
Lesson Plan
Title: Create a Safe Bungee Cord for Washy!
Students learn about how engineers and mathematicians play a role in developing the perfect bungee cord length. They infer and collect data by simulating the process using washers and rubber bands. They analyze the data using scatter plots and calculate the slope, linear equations of the line of best fit, and the spring constant using Hooke’s Law. They learn about the physics of this experiment by studying force and displacement. Civil engineers plan and design large construction projects such as airports, tunnels, and bridges. They must learn to interact with and articulate their ideas and designs to other engineers. When developing bungee cords, they must have a general understanding of overextension and tension. Civil engineers require extensive knowledge of calculus and linear equations. Students play the role of civil engineers as they design and simulate bungee cords. Students apply linear equations when making plans for the bungee cord.
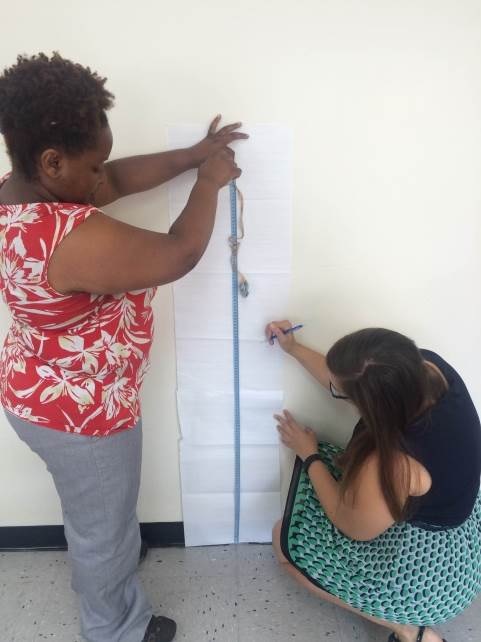
Figure: One person is dropping the washer and the second is observing and recording the displacement of the washer.
Project 4: Stroke Rehabilitation Biometry Device
Teachers: Hau-Yu Chu and Daniella Dilacqua Mentor: Dr. Vikram Kapila, Research Collaborator: Ashwin Kumar
Research
Title: Stroke Rehabilitation Biometry Device
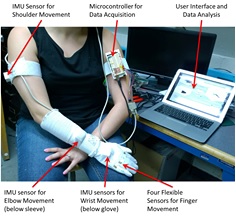
Stroke rehabilitation methods often rely on qualitative data obtained from medical professionals’ observations. Recent advances in technology use various computer programs for therapy, biometry, sports performance optimization, and other human performance assessments. Our proposed system uses flex sensors and Inertial Measurement Units (IMUs) to provide accurate biometric measurements of finger, wrist, elbow, and shoulder positioning for use in assessing stroke rehabilitation progress. Sensor data is processed by a mounted, wearable Arduino and sent via USB cable to a PC running MATLAB software. MATlLAB is used to represent the joint movements graphically. This device is proposed for use in clinical settings in concurrence with traditional qualitative evaluations such as the Wolf Motor Function test.
Figure: Prototype biometry device
Lesson Plan
Title:Using a Microcontroller to Model Biological Principles
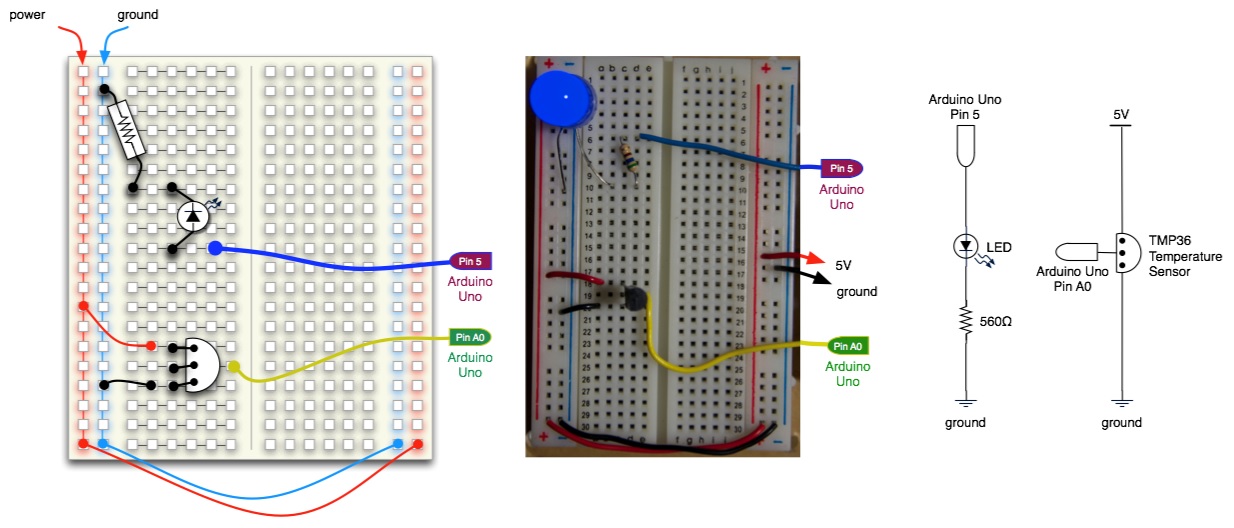
Students construct an experimental unit using a temperature sensor, LEDs, and Arduino microcontroller. They write Arduino program to instruct the LEDs to turn on as the sensor detects a certain temperature range (code basics are provided to them but the students must determine the appropriate range given their setting). When that range is exceeded, the LEDs turn off. In this way, the principle of homeostasis is demonstrated. Students then write a summary paragraph relating the sensor unit to homeostasis.
Figure: Prototype system to model homeostasis
Project 5: Sensing Capillary Action in Soil
Teachers: Yaqi Xiong and Tchnavia D. Merrick, Mentor: Dr. Magued Iskander, Research Collaborator: Eduardo Suescún
Research
Title:Sensing Capillary Action in Soil
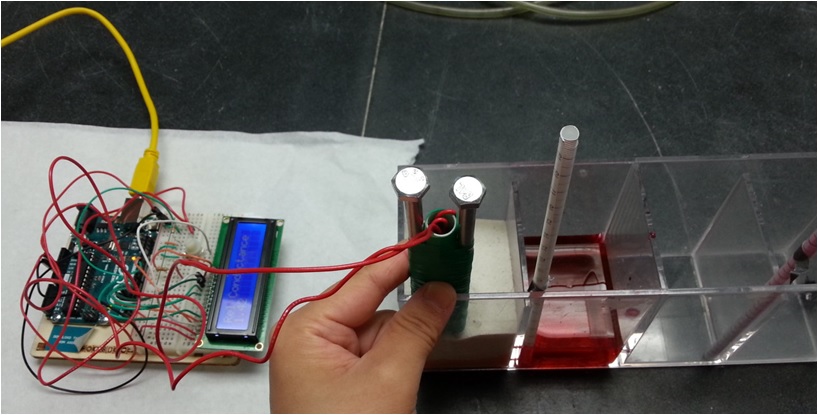
Capillary action in soil is the rising of the water level through openings in the soil. The study of capillarity is essential in the field of geoengineering and agriculture. The research objective is to build an interactive capillary chamber that can accurately quantify capillary action in soil. The potential product, incorporating built-in LED, sound, and robotic arms, will be marketable to educators and students. The capillary chamber was designed using a rectangular box made of acrylic and a touch sensor was interface to an Arduino to detect water level increase in different soil samples. The probe was inserted into the soil to test increases in the water level due to capillary action. Once the probe comes in contact with water, the Arduino activates the LEDs and piezo buzzer. A conductivity sensor interfaced with an Arduino was also used to measure current flow at different heights of the sand profile. The rate of capillarity was measured using a straw. At the conclusion of this research, the touch sensor was discovered to have successfully detected water in the soil. The data collected via the conductivity sensor indicates that current increases as the distance to the bottom of the chamber decreases and rates of capillary action occur fastest in coarse sand, i.e. colored crab sand.
Figure: Arduino conductivity sensor with LCD
Lesson Plan
Title: Sensing Capillary Action in Soil
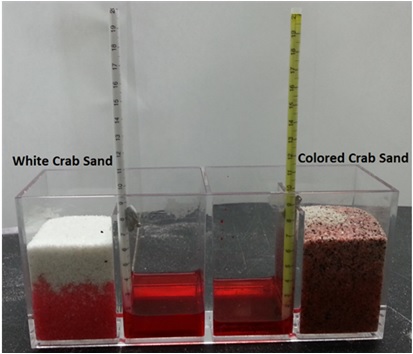
Students will design and conduct a controlled experiment to quantify capillary action in soil. Like engineers and entrepreneurs, students will use affordable materials to design and construct a model to measure the rate of capillary action in four types of sand - coarse, medium, fine, and mixed. In the design process, students will be given a budget and calculate the final cost of their product. After the construction of their design, students will take measurements using their device to quantify rate of capillary action. Next, students will use graphs and photo images to analyze their collected data and present their findings to the class. Finally, groups will compare data and discuss the pros and cons of their design as a class.
Figure: A capillary chamber measures rate of capillary action in coarse sand
Project 6: The Effects of Non-Biodegradable Waste Materials and Glass Microspheres on Cement
Teachers: Brian Palacios and Lauren Schulman, Mentor: Dr. Nikhil Gupta, Research Collaborator: Dr. Luong & Steven Zeltmann
Research
Title: The Effects of Non-Biodegradable Waste Materials and Glass Microspheres on Cement
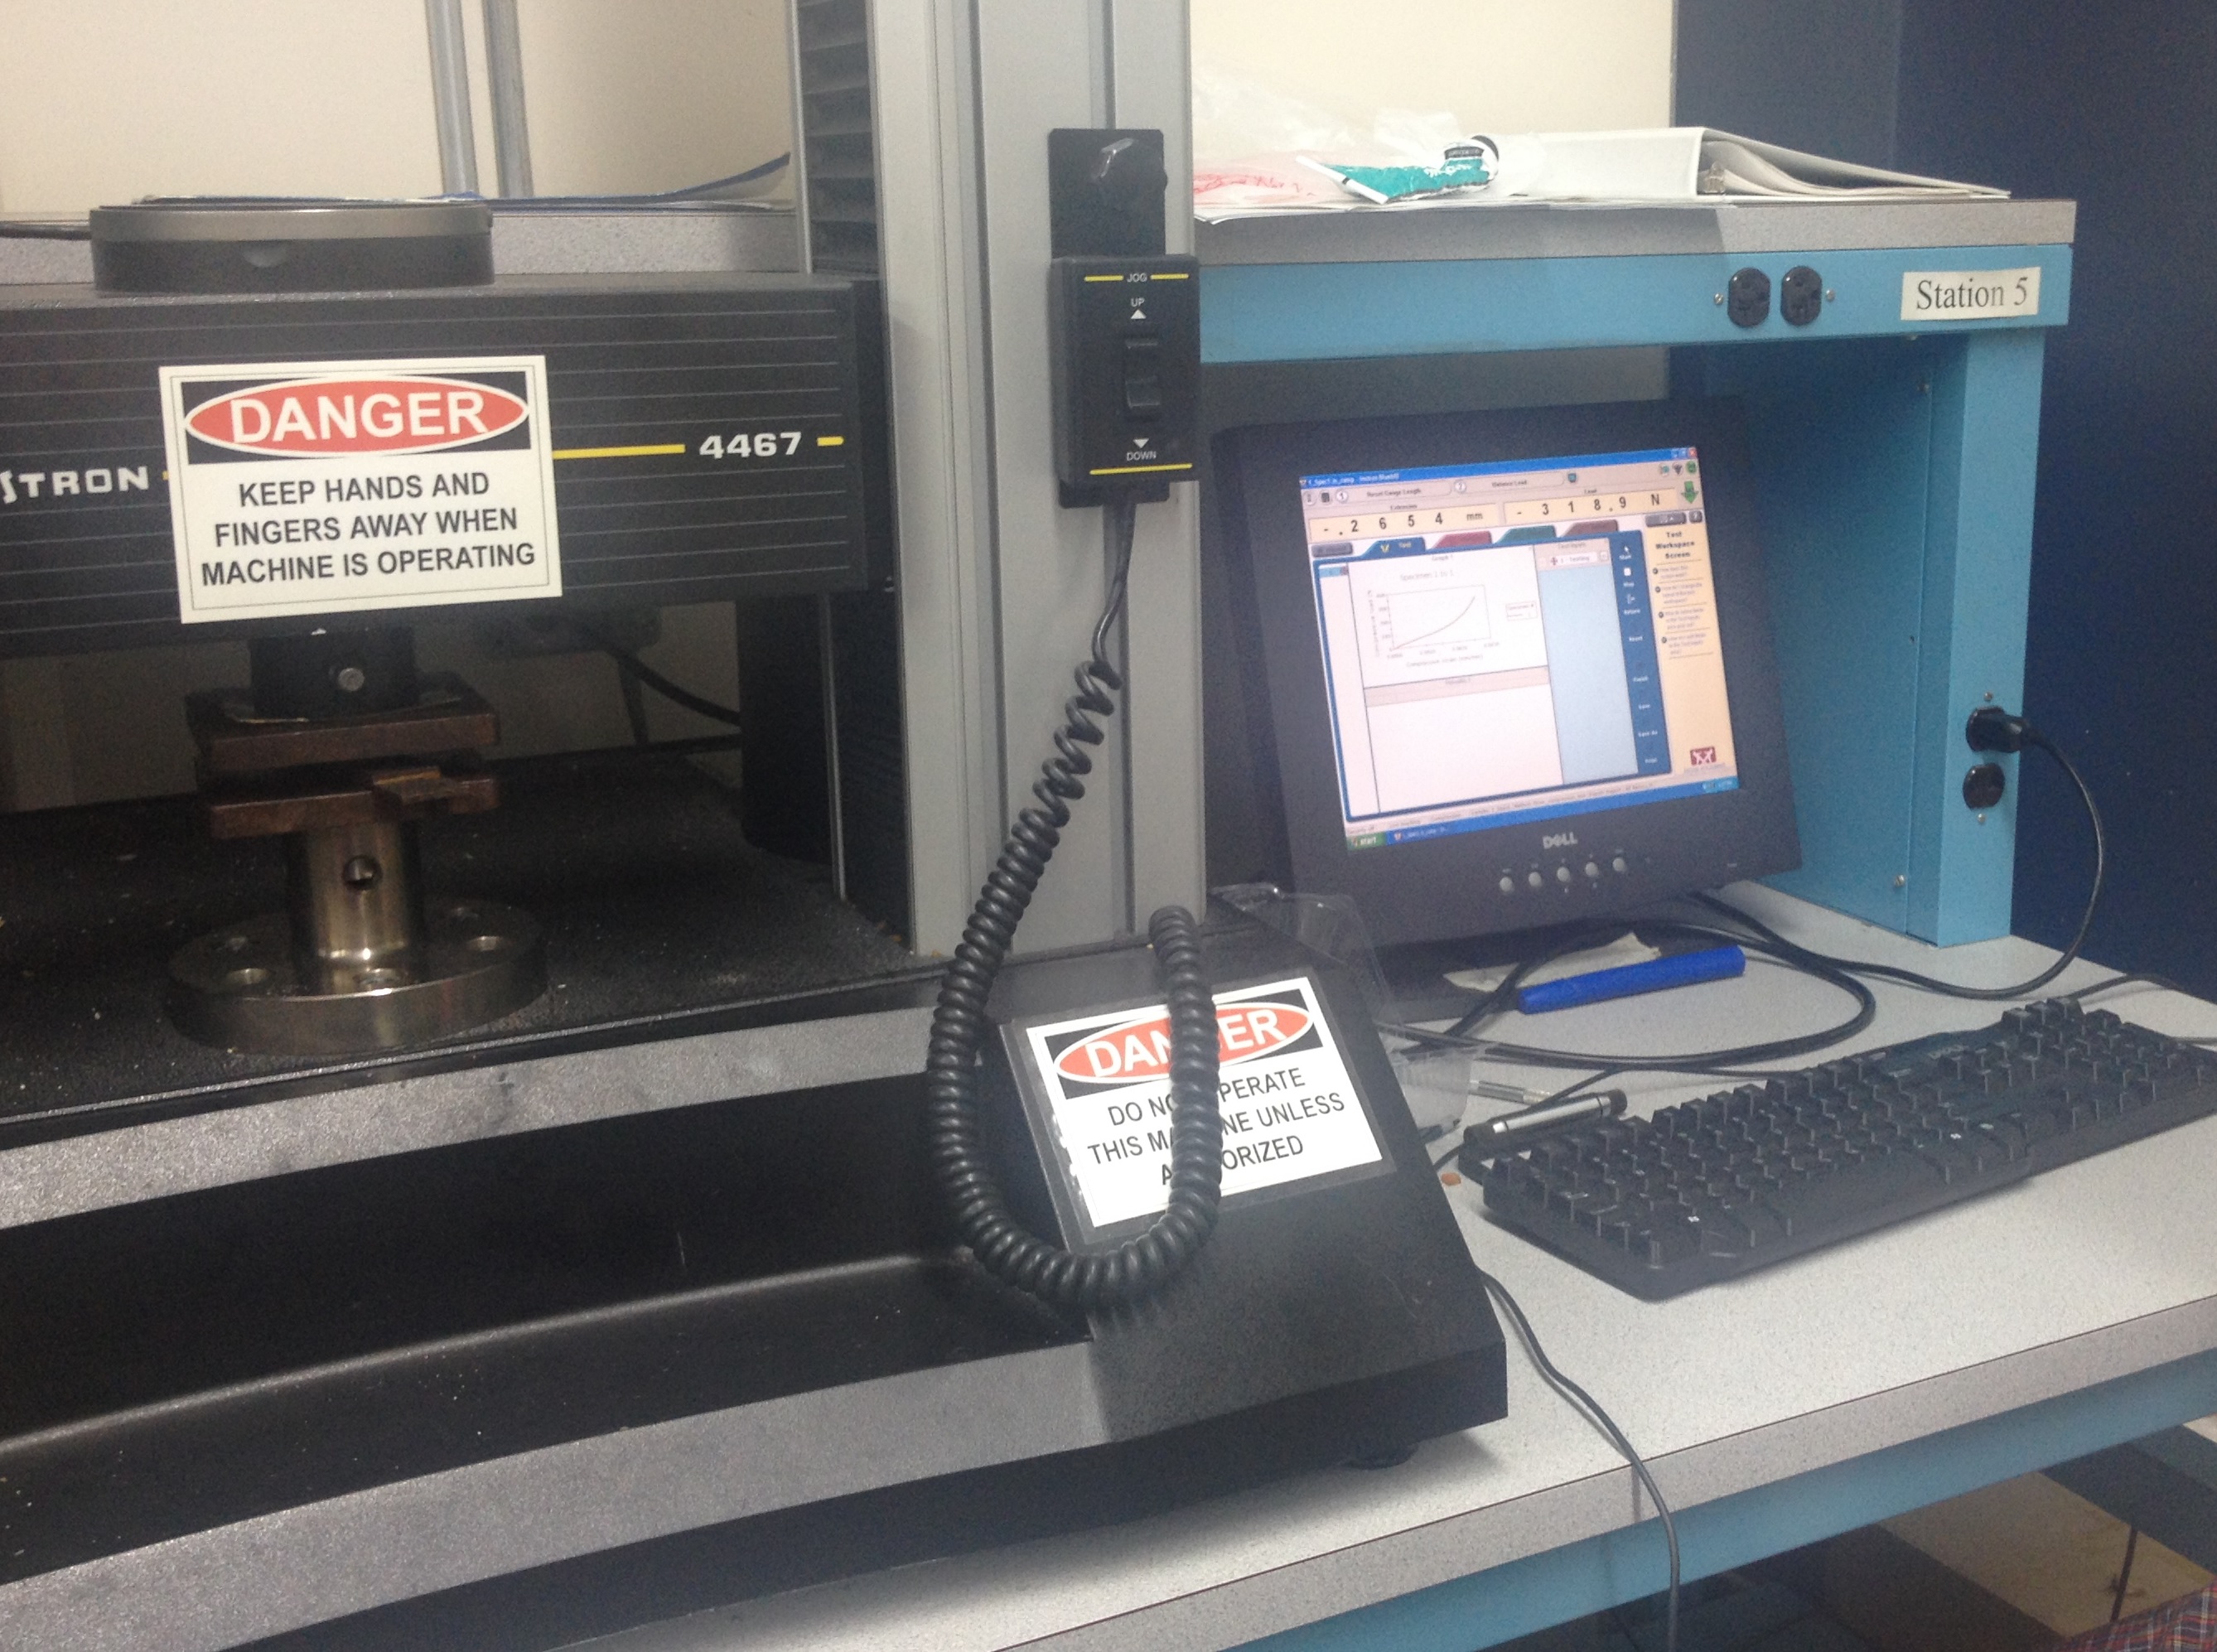
This research was aimed at developing a low density, high strength, environmentally friendly cement composite that incorporates non-biodegradable waste. There were two primary goals in mind for the cement composites: 1) develop cement that is environmentally friendly by incorporating the waste materials of human hair and coal fly ash and 2) create a syntactic foam structure that optimizes durability and strength in the cement while minimizing the density through use of glass microspheres and Class F fly ash. To achieve these goals, cement-based composites were created using various percentages of fly ash, human hair, and glass microspheres. The research was aimed at determining the impact of these materials in the composite mixture and to determine a suitable proportion of materials based on a high strength to density ratio. In using human hair and fly ash, we showcase how non-biodegradable waste materials can be repurposed and reused. The purpose of incorporating the glass microspheres into the matrix was to lower the density of the cement even further while increasing its compressive strength. The fly ash also helps to reduce the density and has a positive impact on compressive strength. The human hair aims to reinforce the strength of the cement and to reduce plastic shrinkage and cracking. Using quasi-static compressive testing yielded insight into the stress-strain optimization of these composites. The use of glass microspheres and Class F fly ash reduced the density of the cement by about 50%, however the peak stress of the cement composites was also reduced by about 80% compared to pure cement. The impacts of the human hair on the cement were inconclusive and seemed to have no effect on the compressive strength of the samples. Further testing using a larger sample size could be conducted in the future and yield more accurate data.
Figure: Quasi-static compressive testing
Figure: Cement composite specimen being compressed
Lesson Plan
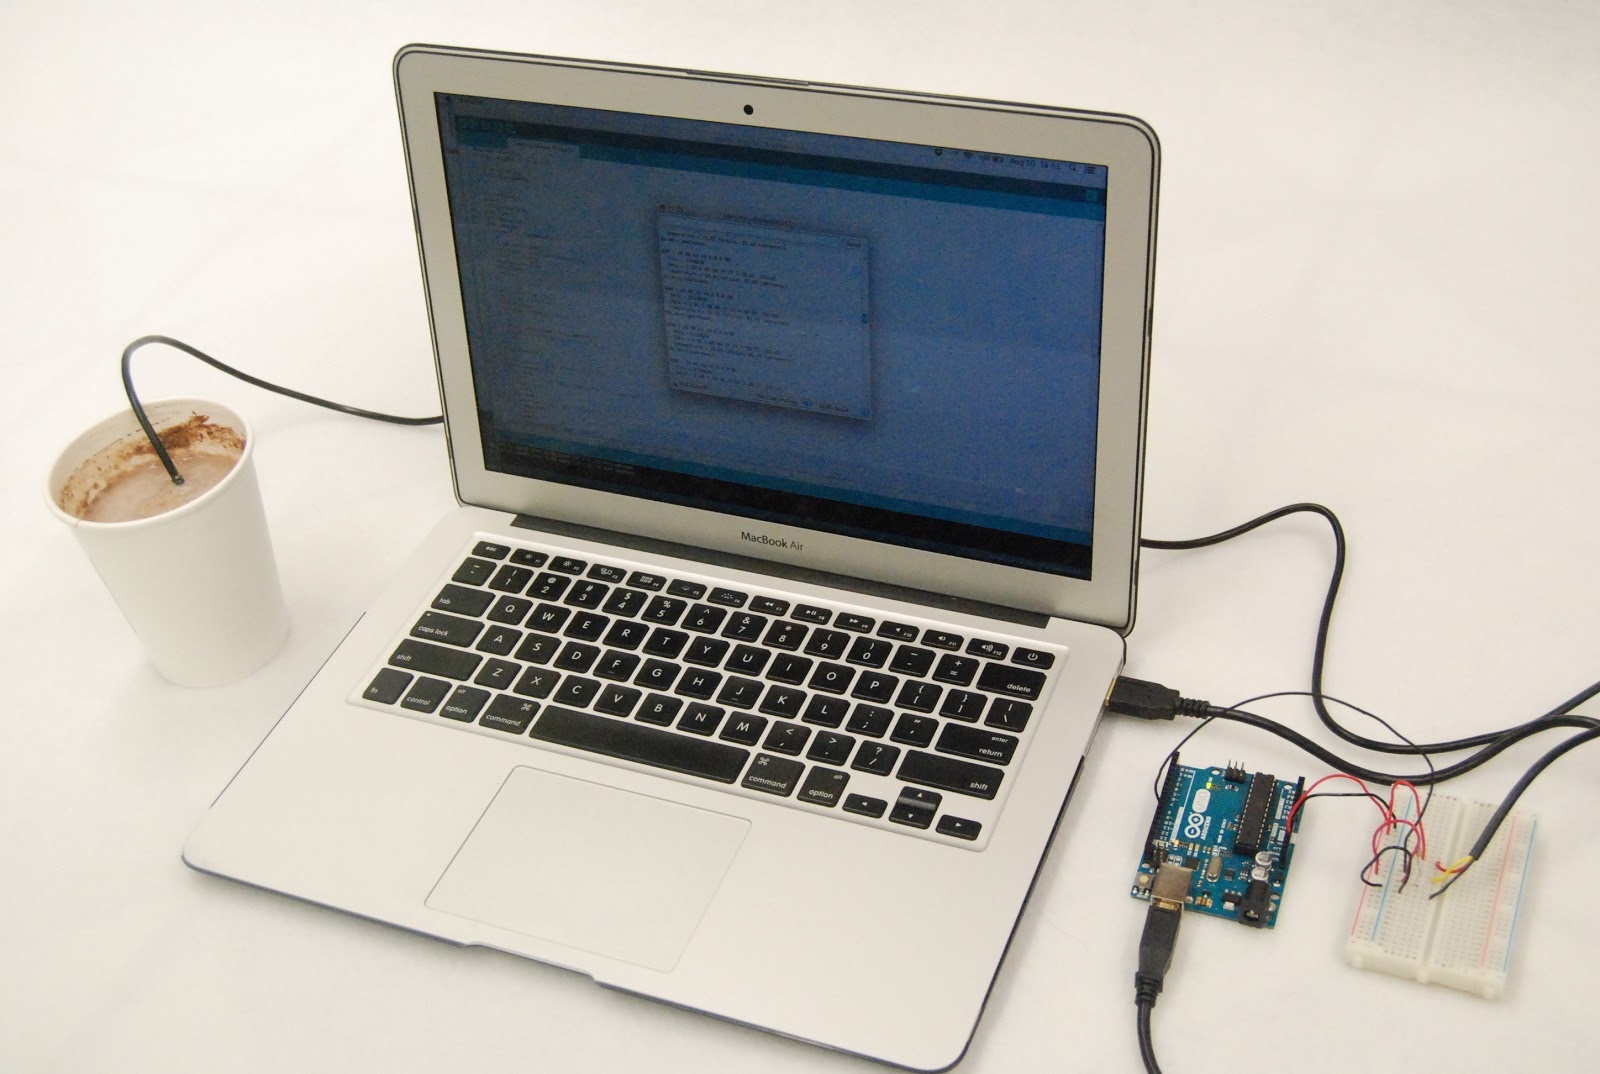
Title: When Should I Drink my Hot Chocolate?
The students complete two separate, but interconnected, tasks using a microcontroller temperature sensor to collect data. In part 1 of the activity, students conduct an experiment to explore the cooling rate of a cup of hot chocolate. Students collect and graph the data to create a mathematical model representing the cooling rate. Using an exponential decay regression, students determine how long one should wait to drink the cup of hot chocolate at an optimal temperature. In part 2 of the activity, students investigate the specific heat capacity of the cup of hot chocolate. They determine how much energy is needed to heat the hot chocolate back up to an optimal temperature after it has cooled to room temperature. The concepts of heat exchange and cooling rates are applicable to a wide range of engineering fields including heating and cooling systems, microprocessors, internal combustion engines, and food engineering to name a few. For example, knowledge of the heat capacity and cooling rates of chocolate is required for engineers to design production machinery, storage equipment, and determining processing times for the production of chocolate. Because physical properties and conditions vary greatly, engineers must also make mathematical models that predict the effects of changes on the systems. Like engineers, students apply the concepts of cooling rates and heat capacity to hot chocolate as they determine the time to reach optimal drinking temperature and the energy needed to heat the hot chocolate to optimal temperature.
