2013 SMARTER Program Project Archive
Project 1: Measuring Electric Current in a Motor for the Purpose of Determining Energy Consumption
Timothy Dennis and Peter Tsun
Research
Title: Measuring Electric Current in a Motor for the Purpose of Determining Energy Consumption
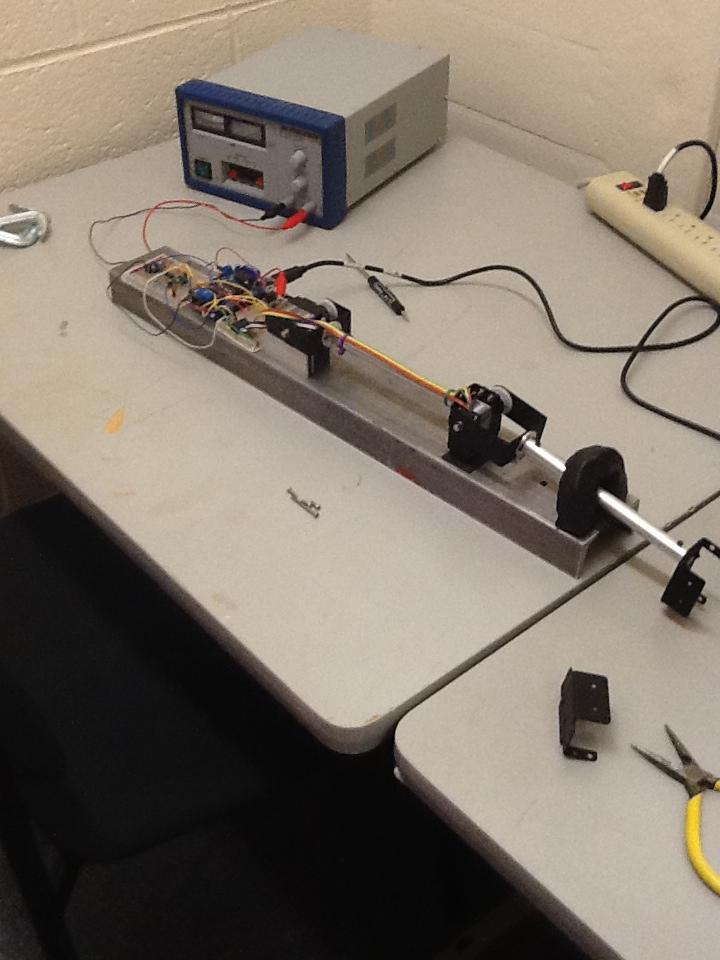
This research addresses the technical challenges of measuring the electrical energy consumed by a DC motor. In particular, the challenge is to accurately measure the electrical current through a DC motor. This challenge arises from the fact that we wish to determine the current consumed by a DC motor that is part of a servo-motor and the current is bi-directional. Two different pre-made sensors and two different op-amp circuits were evaluated to measure the current through the DC motor. The methodology and results of current measurement are documented in the full report and future directions of this research are also discussed.
Test rig for DC motor current measurement
Lesson Plan
Title: Analyzing Motion with an Updated Version of Galileo’s Ramp Experiment
One of Galileo’s many famous experiments consists of rolling a ball down a ramp to understand its motion. Galileo used a pendulum as a timing device and bells to mark the ball position at each second.
Using a ramp with sensors attached to a microcontroller and hand-held stopwatches, students will collect information about the motion of a ball rolling down a ramp. They will compare the data recorded using stopwatches vis-à-vis the data collected using the microcontroller. Due to experimental errors, the two sets of data will differ slightly. Comparing the two sets of data collected by different methods will be a basis for a discussion about accuracy and precision.
Students will look at how the number of decimal places changes the precision of the measurement. Moreover, they will understand that the reaction time of students affects the accuracy of the measurements.
Galileo's ramp experiment
Project 2: 1. Effect of Heat Treatment on the Hardness of Magnesium Alloy AZ91D and 2. The Effect of Microballoon Density and Strain Rate on the Properties of Syntactic Foam Composites
Jason Rann and Charisse Nelson
|Presentation Slides 1| Presentation Slides 2|
Research
Title: 1. Effect of Heat Treatment on the Hardness of Magnesium Alloy AZ91D and 2. The Effect of Microballoon Density and Strain Rate on the Properties of Syntactic Foam Composites
The current research is aimed at analyzing the effects of heat treatment on a recently developed Magnesium Aluminum Zinc alloy, AZ91D. Composite materials like AZ91D are important to study because they can outperform commonly used materials in certain scenarios based on specific characteristics such as strength, strength to weight ratio, density. The main purpose of Jason’s research was to determine the Vickers Hardness value for the AZ91D when exposed to heat treatment procedures such as solution treatment (T4) and solution treatment + ageing process (T6). Moreover, he focused on comparing this data to commonly used materials in the industrial world, specifically aluminum and steel. Finally, he also analyzed the hardness progression of AZ91D through the heat treatment process.
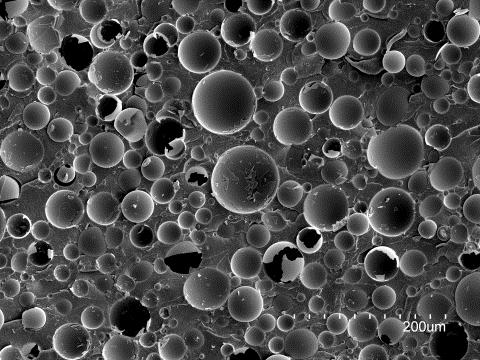
Charisse studied syntactic foams, which are mechanical mixtures of microballoons in a matrix material. Microballoons are tiny hollow glass structures that when combined in a matrix allow the new composite material to be both sturdy and lightweight. One notable use of syntactic foams is by the US Navy in the restructuring of a human operated underwater vehicle, Alvin. The foams aid in buoyancy effect on Alvin, thereby allowing the Navy to create a vehicle that can operate smoothly even when carrying all of Alvin’s necessary equipment. Charisse’s research looked at how change in the wall thickness of the microballoons (and thus the density) and the rate at which the foams were stressed influenced properties of the foams. Two syntactic foams with different densities: SF220 and SF460 were studied at different strain rates from 0.001 to 0.1 s-1. The stress was observed to increase with the strain rate for 460 type and the modulus values showed an increase with the strain rates for both the 220 and 460 types.
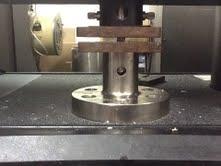
Syntactic foam with microballons and a material testing apparatus
Lesson Plan
Title: Test and Compare Material Properties
Most classroom environments engage students in overly structured and guided problem solving. The real world does not always have these luxuries. Thus, it is imperative that students experience independent problem-solving, make claims, and use data to defend their claims. Moreover, the classroom assignments students face are often abstract or irrelevant to their lives. The proposed activity will help remedy the above two issues. First, it will require students to collect real data of their own and compare some of their data to existing and accepted data for accuracy. Second, it will allow students to function in an environment with minimal teacher interaction. The teacher in this scenario is a facilitator and an observer, helping ensure students’ safety in the lab and instructing them on equipment use. Lastly, the proposed activity will give students an opportunity to choose a prompt they want, make a claim, and then defend their claim with data they collected themselves. Exposing students to activities like this will help them experience collaborative work, independent and divergent thinking, and real-world problem-solving.
Students will gather specific information on the density, hardness (using a pre-built macrohardness tester), and cost to weight ratio for an array of materials (aluminum, wood, plastic, etc.) and then using this information defend a material choice for three different build scenarios.
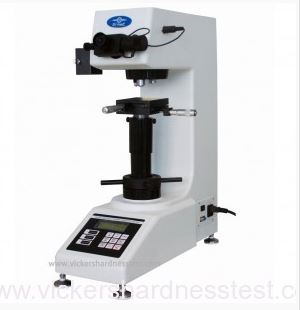
An example of a Vickers hardness tester for common materials used to examine the microstructure of a material and test the hardness of the material. The lesson plans goal is to simplify this process and make it feasible for students to produce similar, more conceptual results for hardness values for several materials.
Project 3: Testing a Transparent Hydrophilic Copolymer as a Suitable Soil for the Observation and Study of Plant Root Growth
Linda Dombi & Jason Econome
Research
Title: Testing a Transparent Hydrophilic Copolymer as a Suitable Soil for the Observation and Study of Plant Root Growth
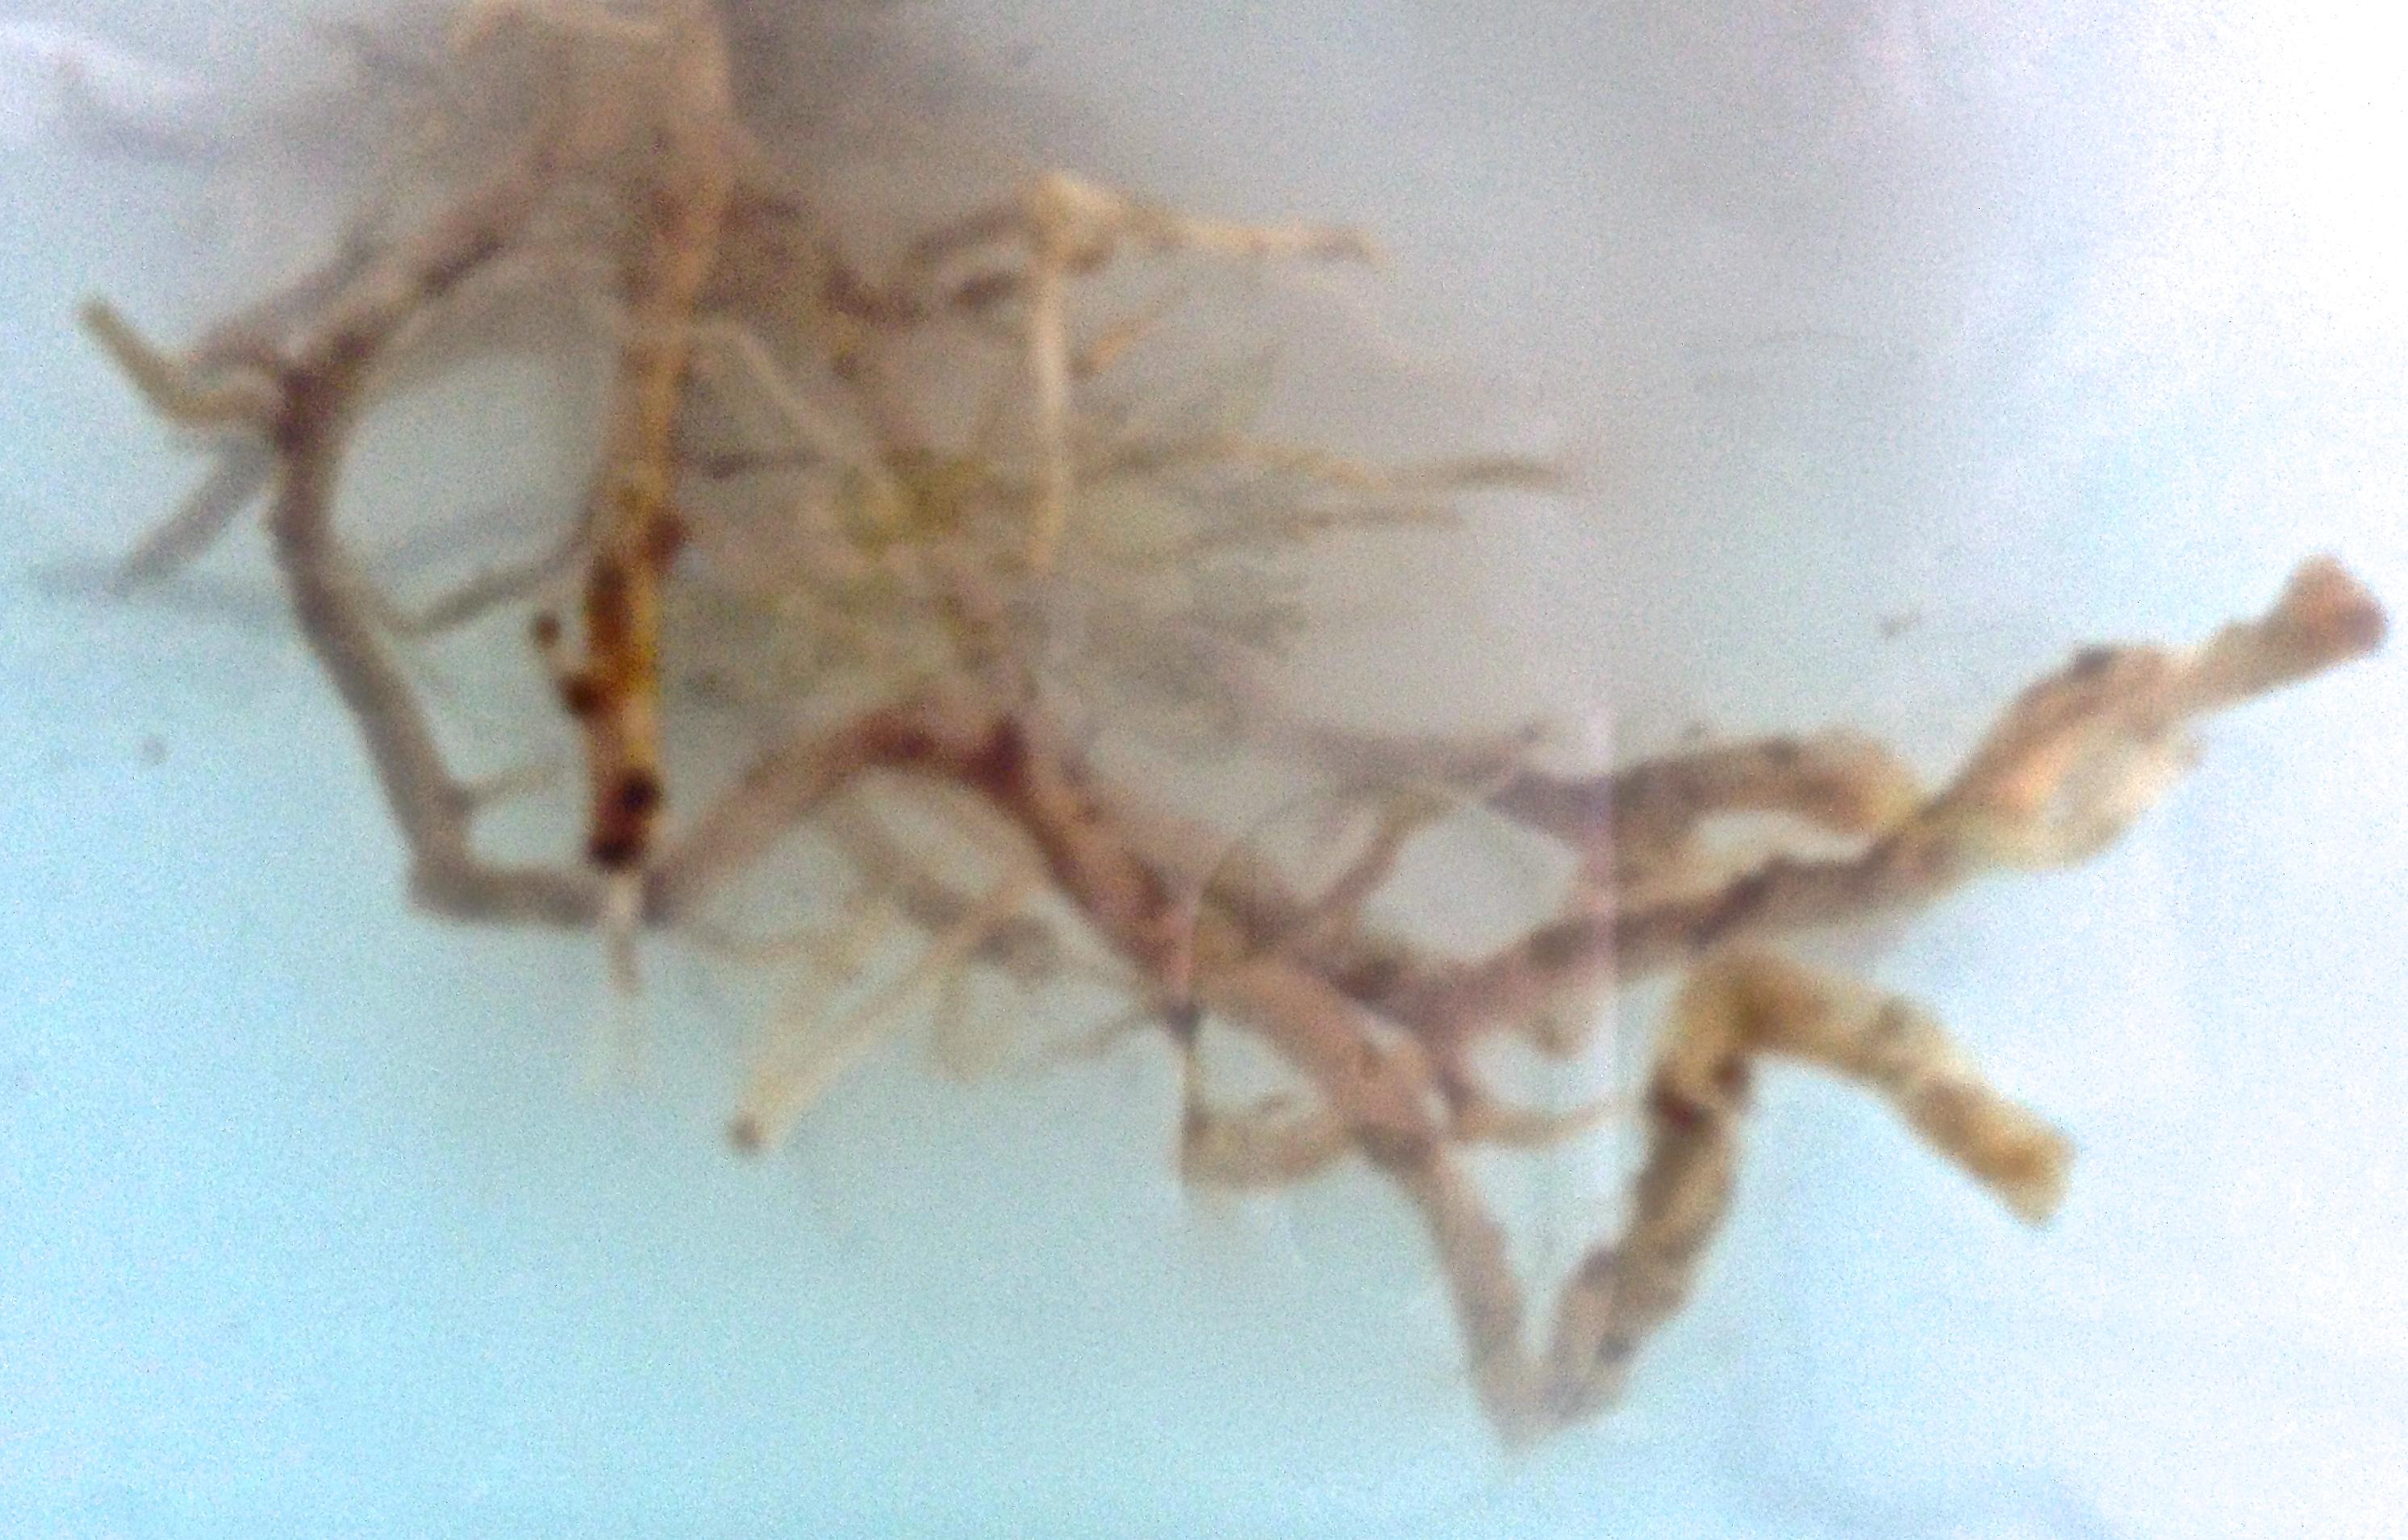
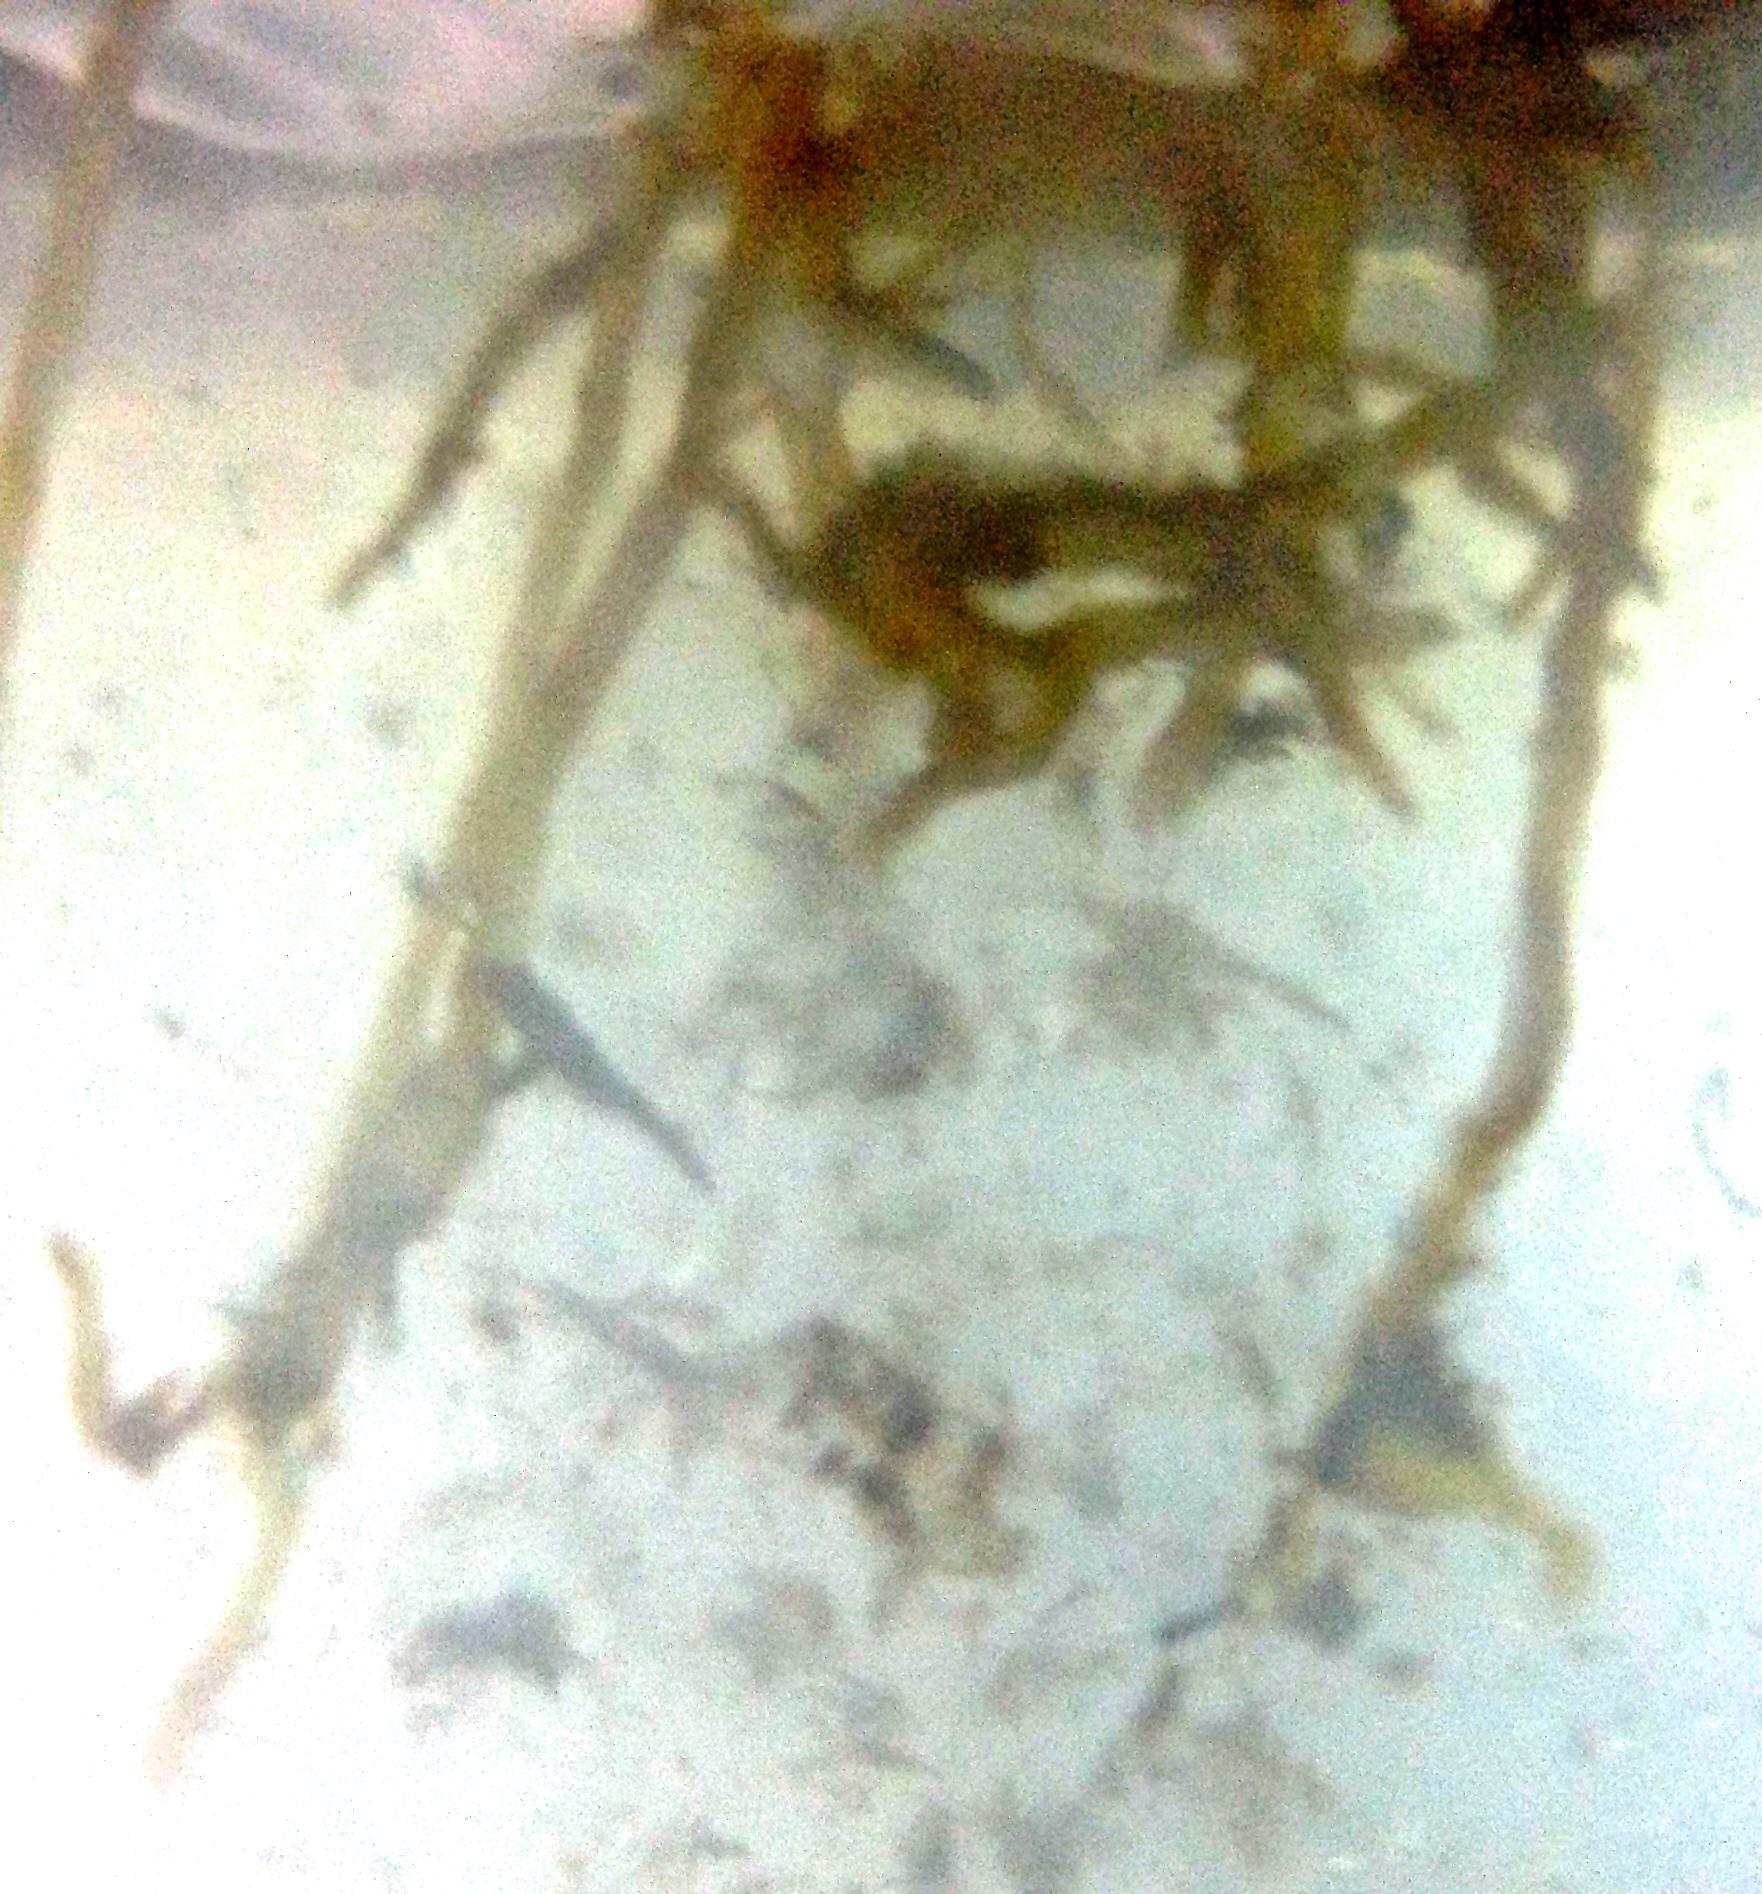
A plant’s root system is critical to its health. The ability to view, through the means of a transparent soil, how roots anchor a plant, absorb water, and absorb necessary nutrients, will help us to optimize conditions for plant growth. What is learned from this study can impact existing agricultural methods in many ways. The fact that this transparent soil can retain up to 200 fold their weight in water means crops can now be farmed in more arid environments. Moreover, being able to see how microbes interact with a plant’s roots, we can improve nitrogen fixation or retard disease transmission thus improving crop yields. This study used Aquabeads, an ionized copolymer, to construct the transparent soil. When hydrated these beads are nearly transparent with a refractive index matching that of water. A number of supplements were tested to give the plants the best chance of surviving in their new environment. Research goals were to optimize the soil conditions for plant growth while, at the same time, improving transparency. It was demonstrated that an Aquabead-based soil visibly and quantifiably supports growth of a plant.
Sample plant roots invading the Aquabeads transparent soil
Lesson Plan
Title: Transparent Soil? That Hot!
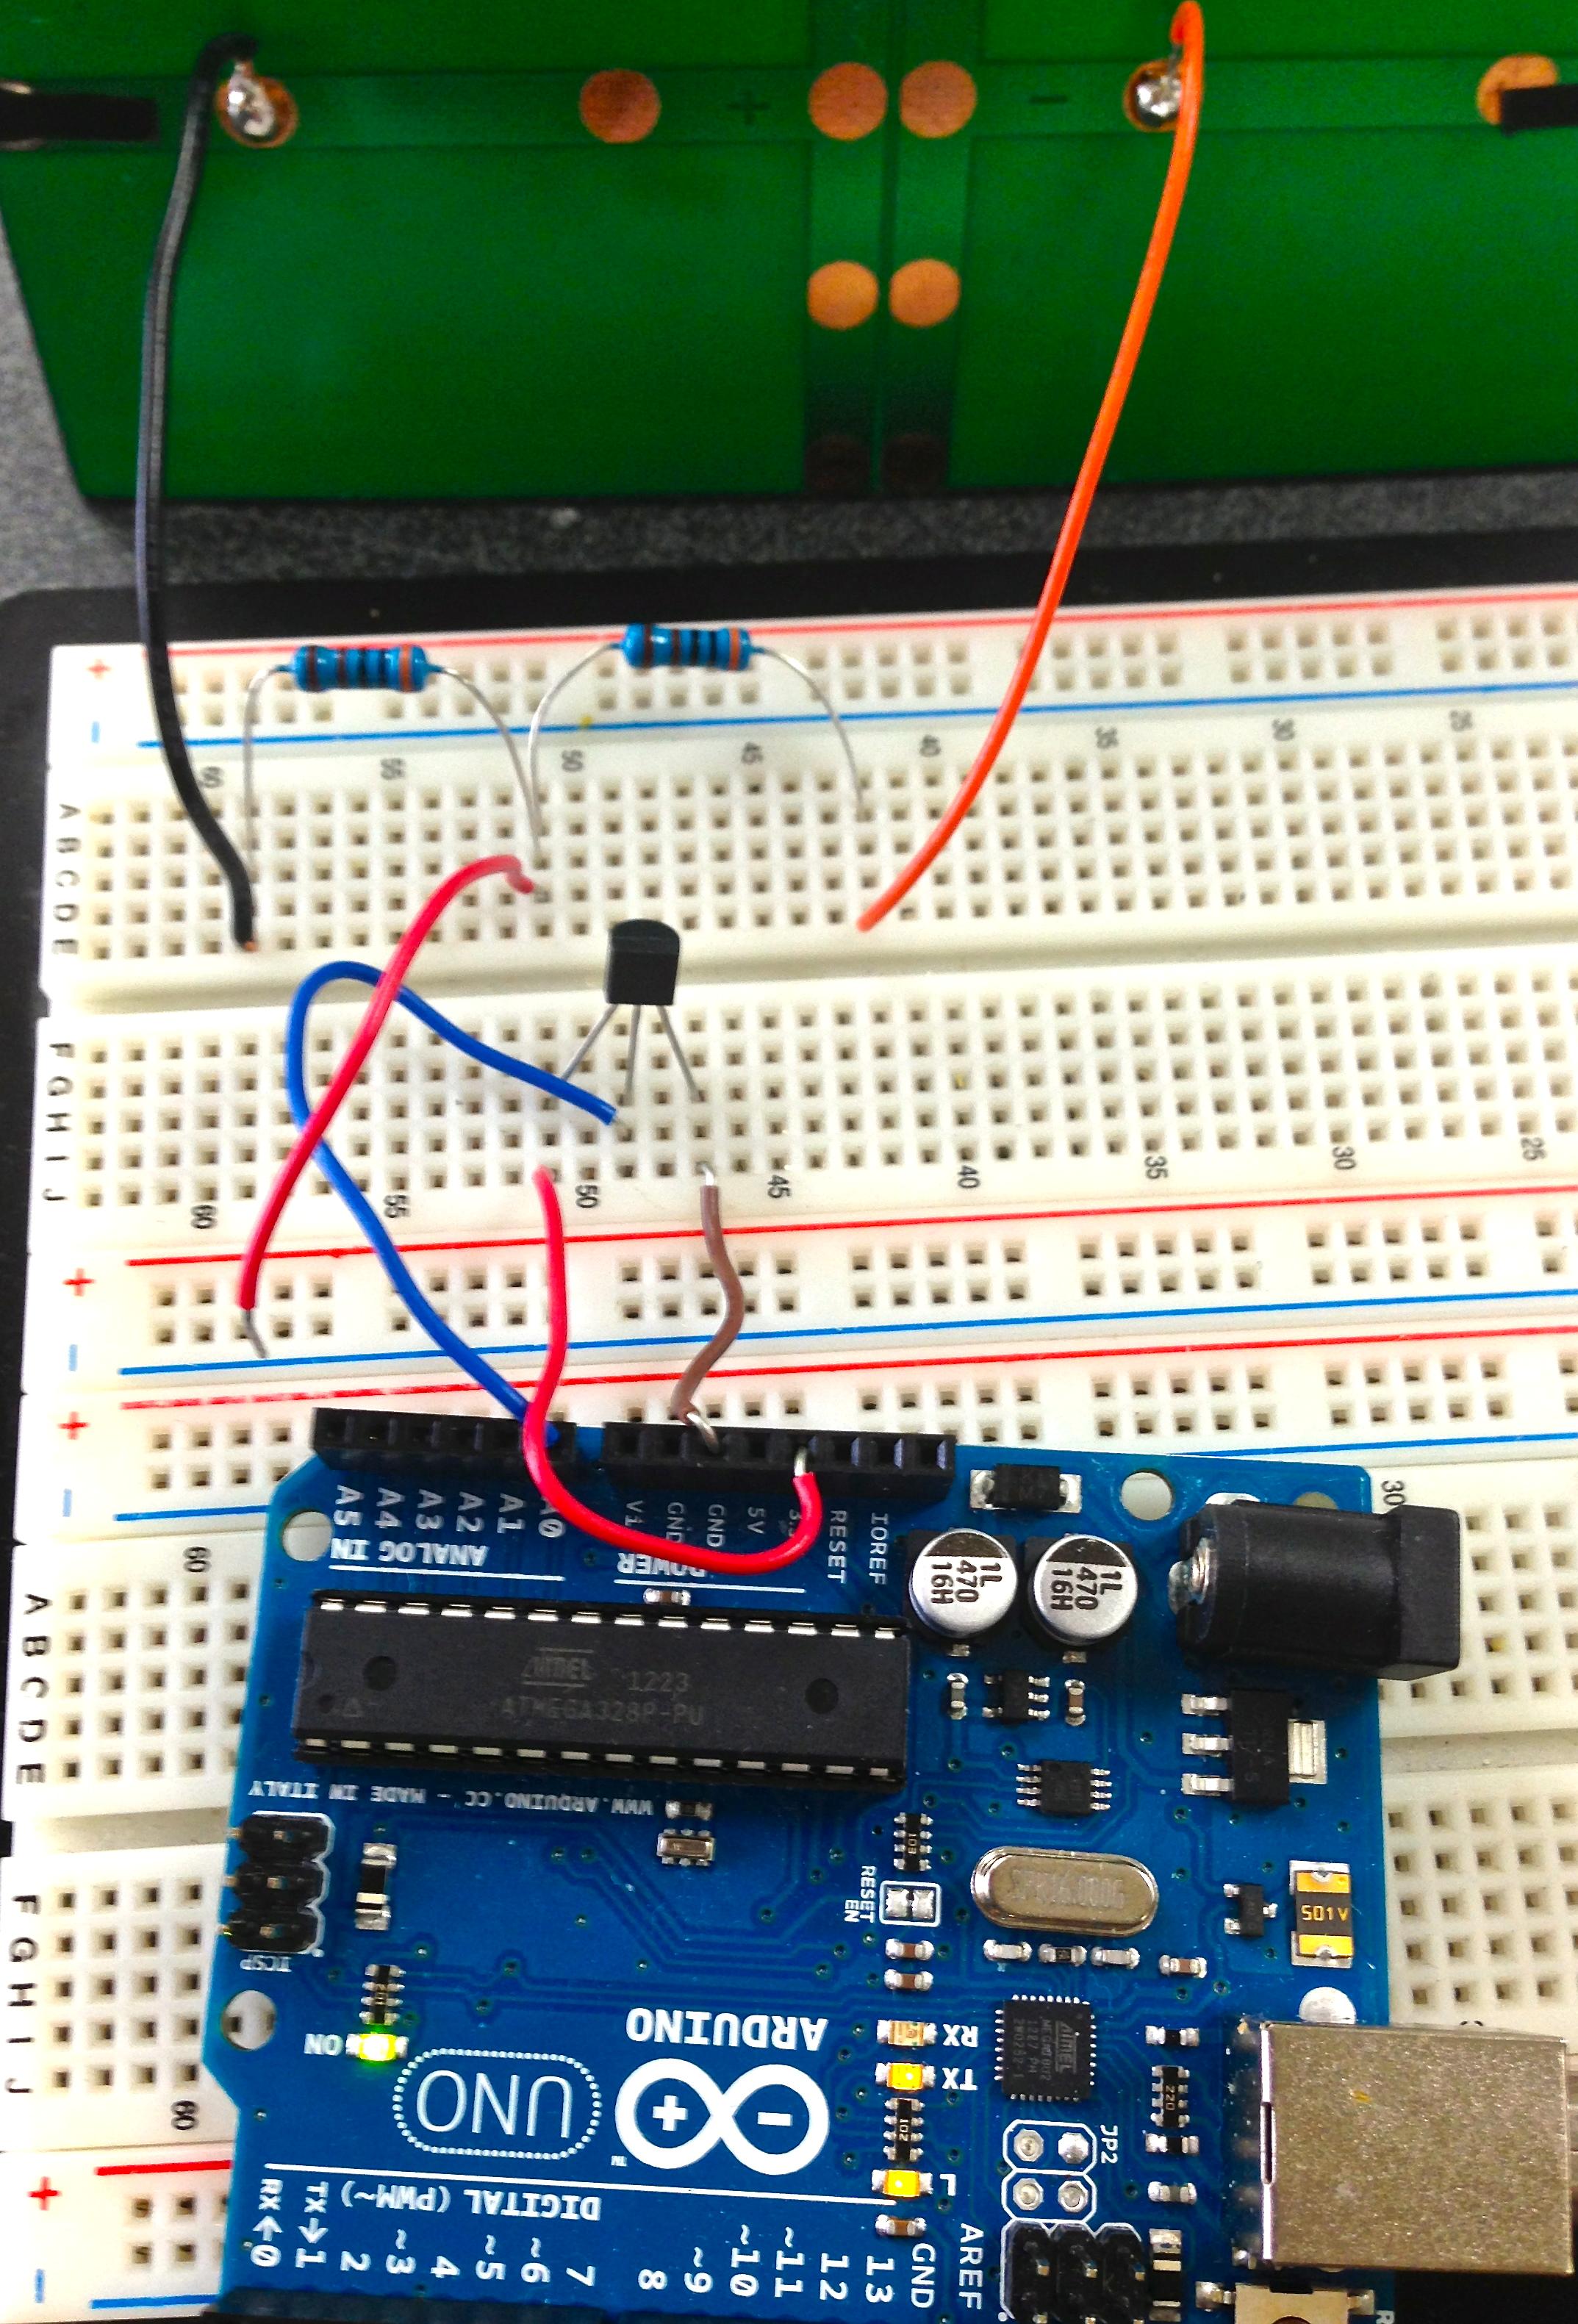
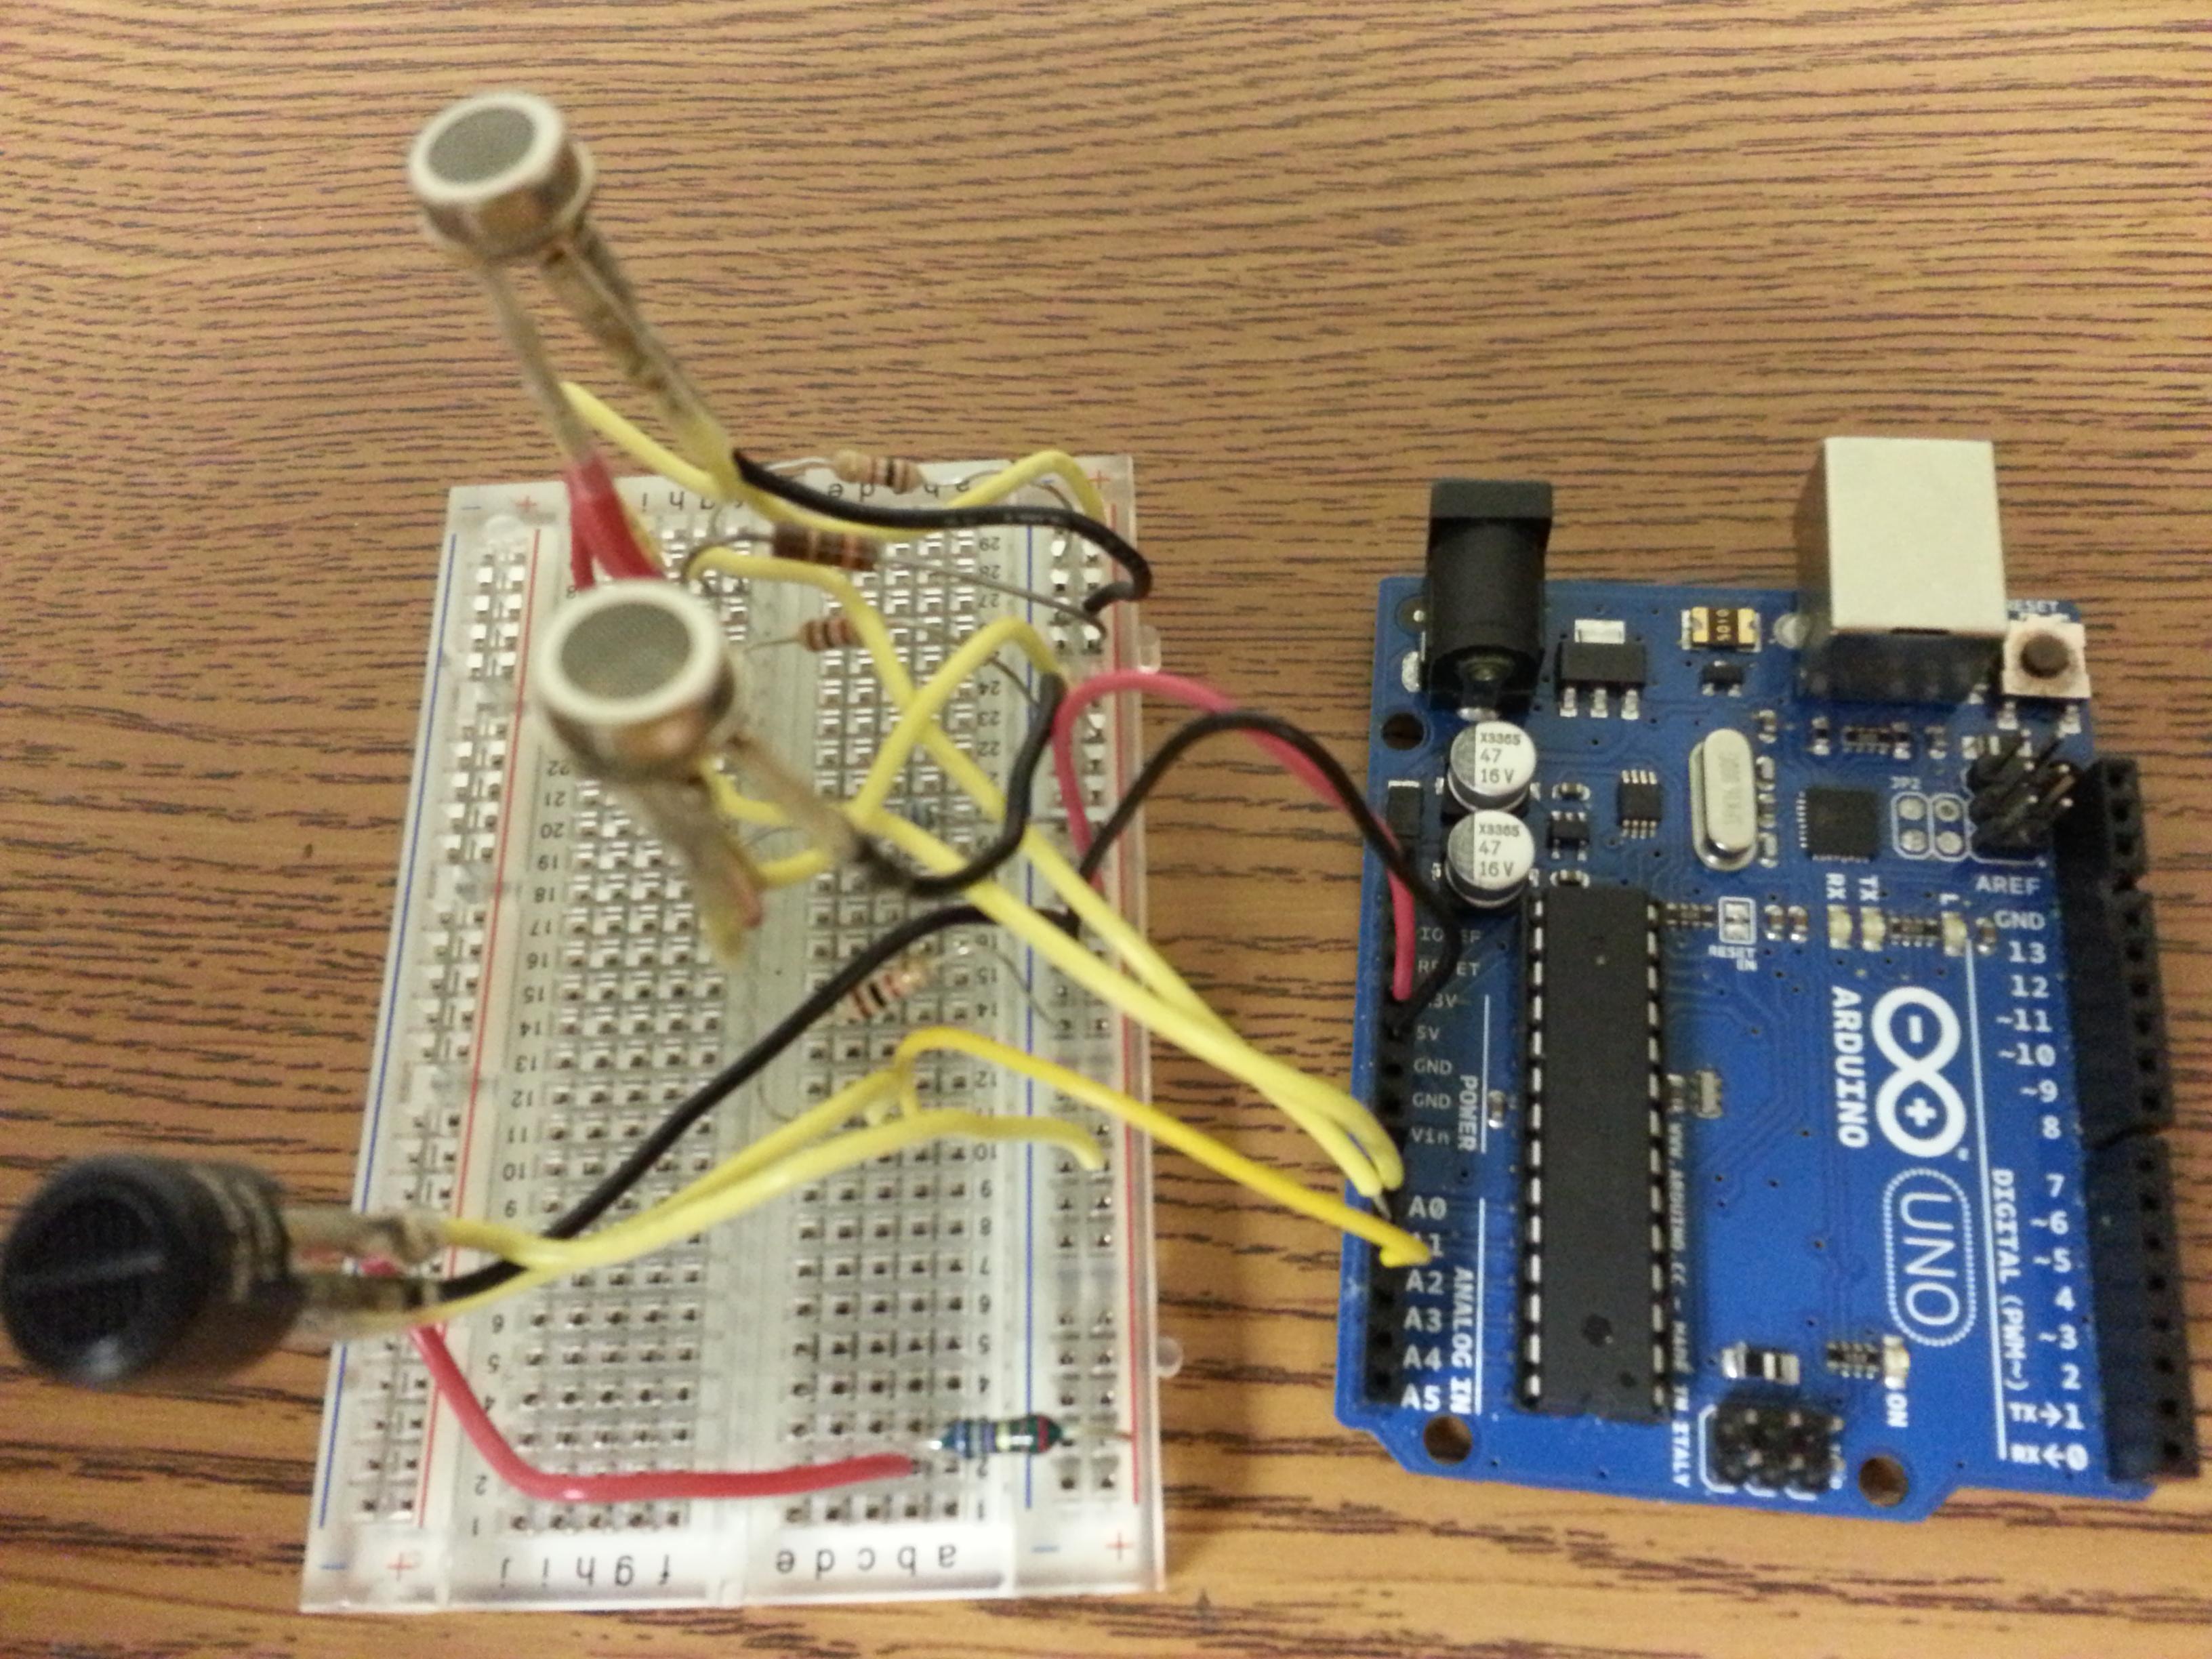
Groups of students will research, design, and construct their own terrarium. They will identify those key factors that allow a plant to adequately perform photosynthesis. Such critical factors may include the concentration of bead to water mixture, the amount of light, water, and temperature. In subsequent weeks, student groups will periodically monitor conditions and record root growth data. In addition, the students will assemble a thermal sensing apparatus. They will build an enclosure for their thermal sensor, calibrate it, and build a circuit using a breadboard and an Arduino microcontroller. At the conclusion of the project they would present their findings to their classmates.
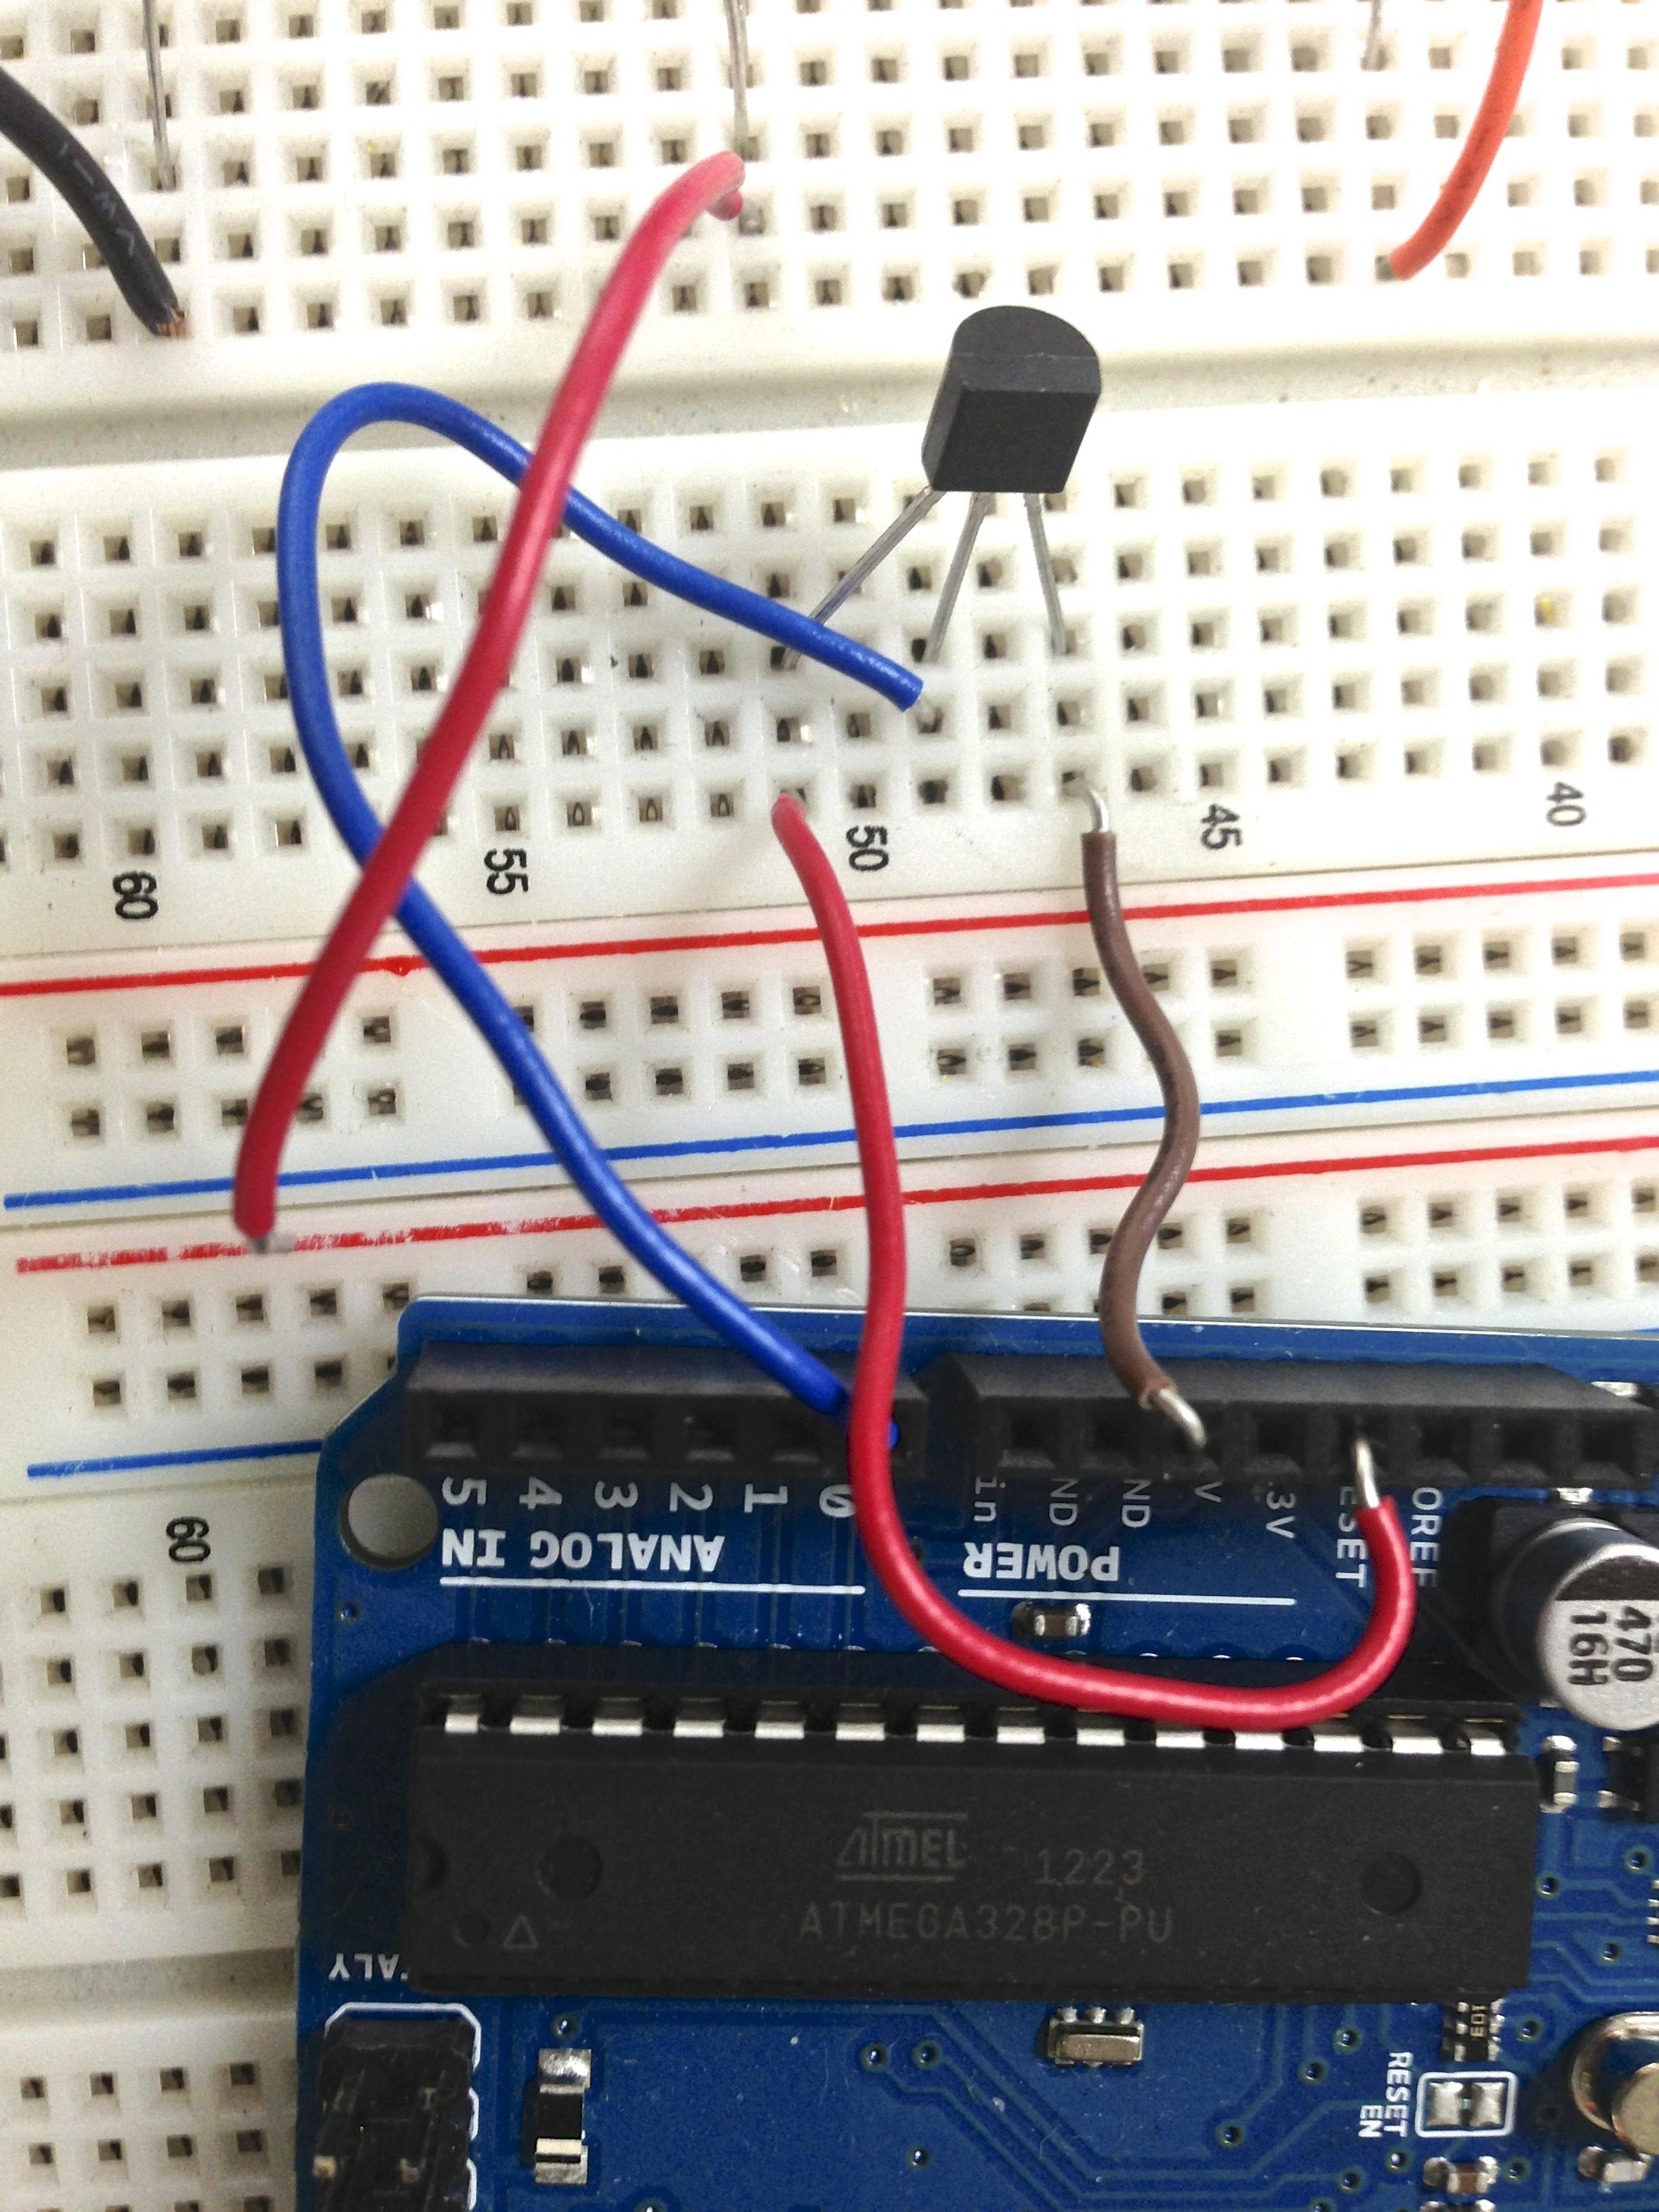
Sample circuitry with temperature sensor and Arduino microcontroller
Project 4: Facial Recognition and Learning with Embedded Computing
Kelly Brandon and Jigar Jadav
Research
Title: Facial Recognition and Learning with Embedded Computing
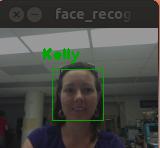
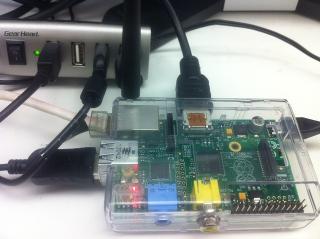
Human fascination with robotics continues to grow as technologies and algorithms improve. One way in which humanoid robots can behave more like humans is to design robots to distinguish between objects and people, as well as learn to recognize new objects and people. An algorithm was developed using Local Binary Pattern Histograms (LBPH) for facial recognition, and a combination of K Nearest Neighbors (KNN) and confidence threshold values for facial learning. The system is designed for a Cellulary Accessible Expressive Semi-Autonomous Robot (Robot-Head), a humanoid robot in development at NYU-Poly’s mechatronics lab. Robot-Head’s eyes consist of two webcams that may be used for face recognition and learning. However, the system was implemented and initially tested on a laptop with a built in webcam. Robot-Head continues to grow as parts are continuously designed, made, and tested on the robot’s body. Currently Robot-Head’s processing and control comes from an attached laptop acting as its brain. The use of a single-board, embedded computer, e.g., a Raspberry Pi, was investigated to replace the laptop. Initial testing revealed that video capturing on the Raspberry Pi is slower than that of a laptop. However, the facial recognition and learning system was still able to recognize and label known faces and learn new faces using the embedded device. Such a system with facial recognition and learning on an embedded device may be used in robots, security systems, or even as smart doorbells.
Illustration of facial recognition and a single-board embedded computer
Lesson Plan
Title: Angular Velocity: Sweet Wheels
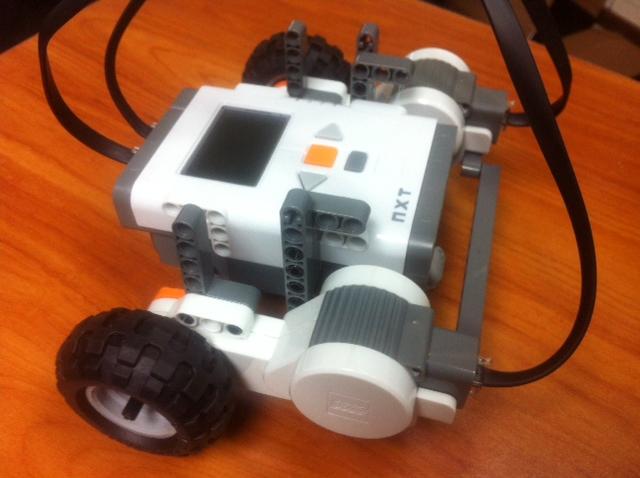
Groups of students will predict, measure, and analyze the relationship between linear velocity, wheel radius, and angular velocity using a LEGO NXT robotic vehicle. Students will use pairs of wheels with various radii to compare the times the vehicle takes to travel a set distance. Group data is collected and analyzed to find the angular velocity of the vehicles, which are all set to the same motor speed. Students will experiment with the variables such as radii and motor speed (angular velocity) and other factors such as weight that they may discover, to optimize the speed of the vehicle. A group discussion will ensue relating the conclusions from the investigation to cars, trucks, bicycles, and other such vehicles.
Illustrative LEGO vehicle for classroom lesson
Project 5: Design and Function of Robot-Head, A Humanoid Robot
Alexa Goldstrom and Zulficar Habib
Research
Title: Design and Function of Robot-Head, A Humanoid Robot
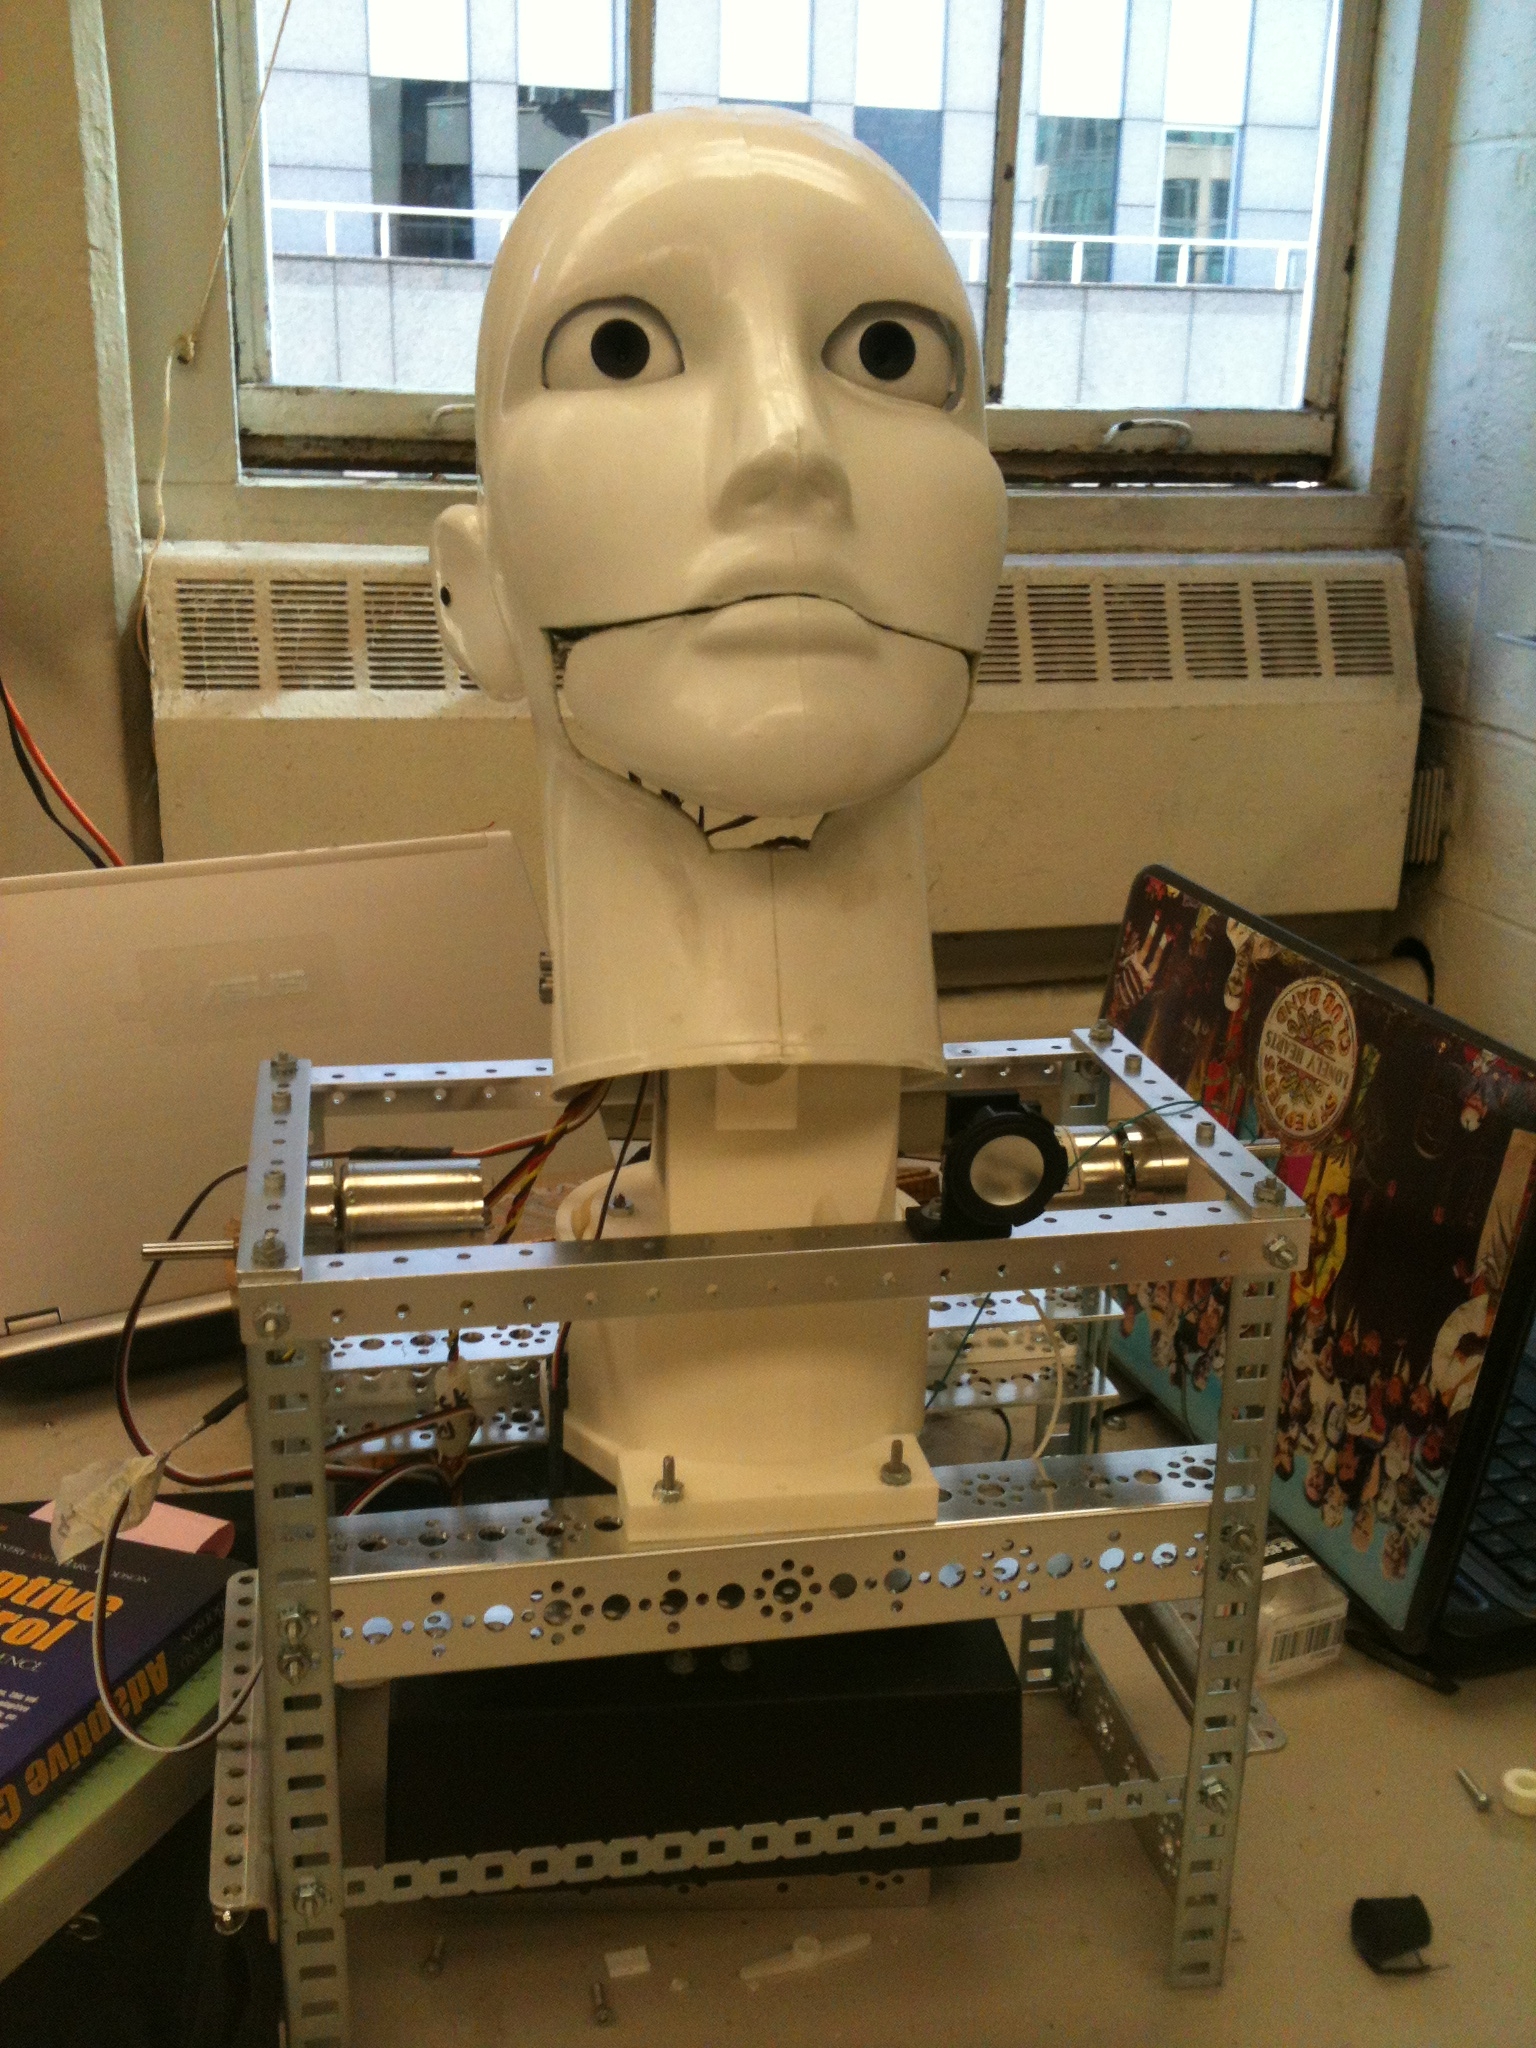
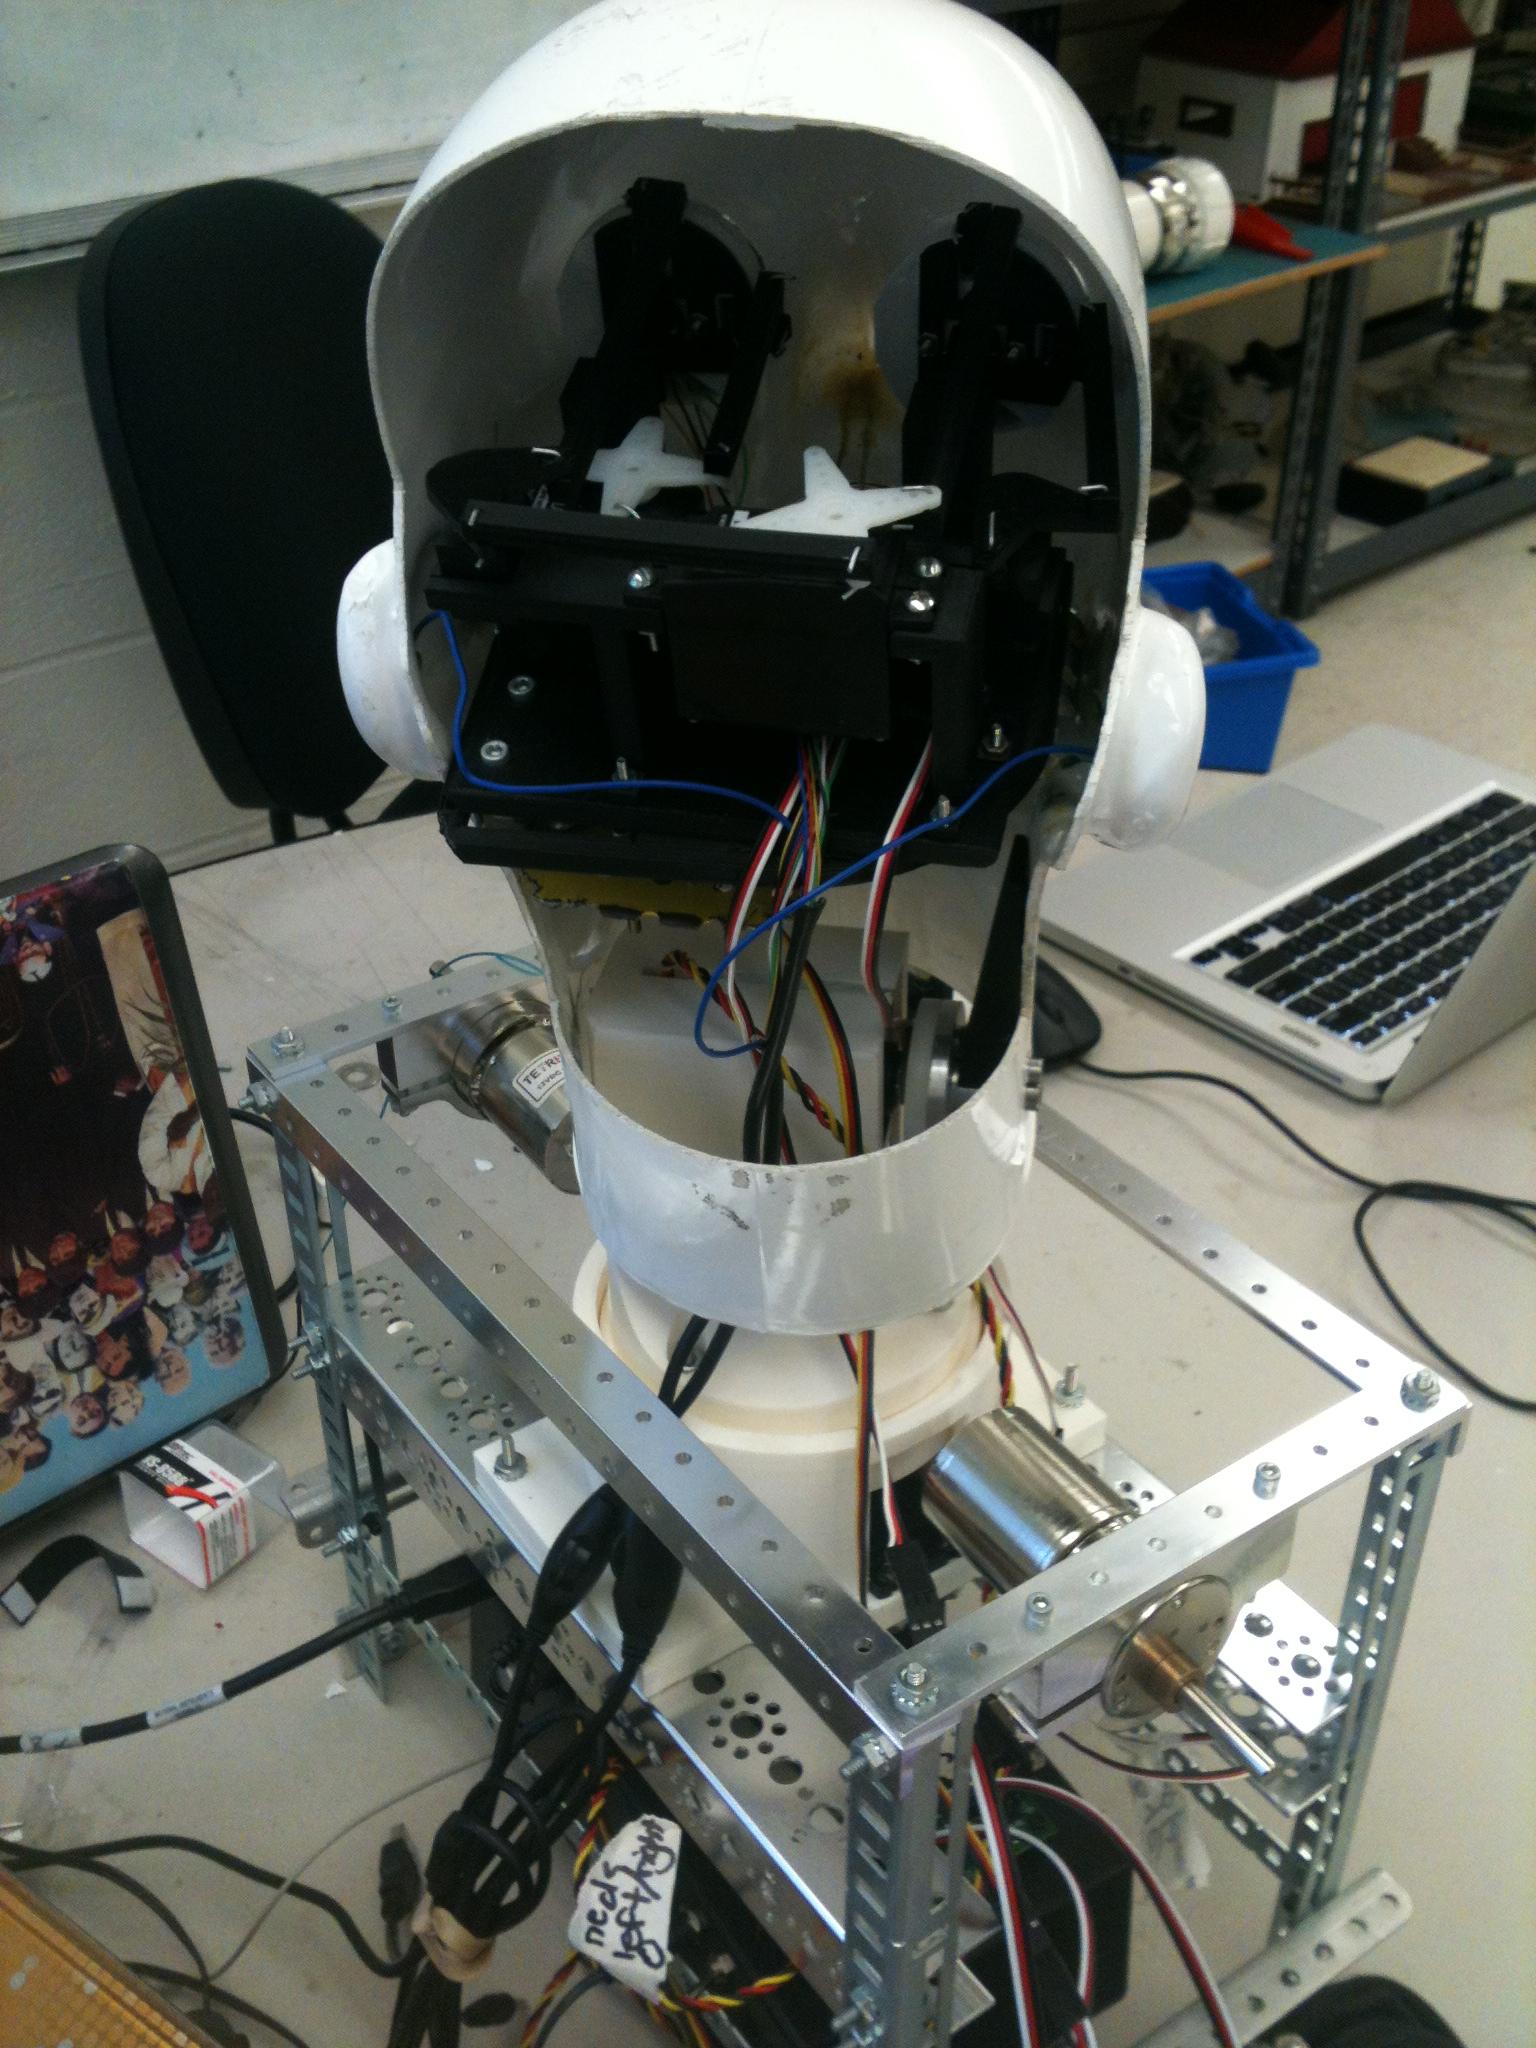
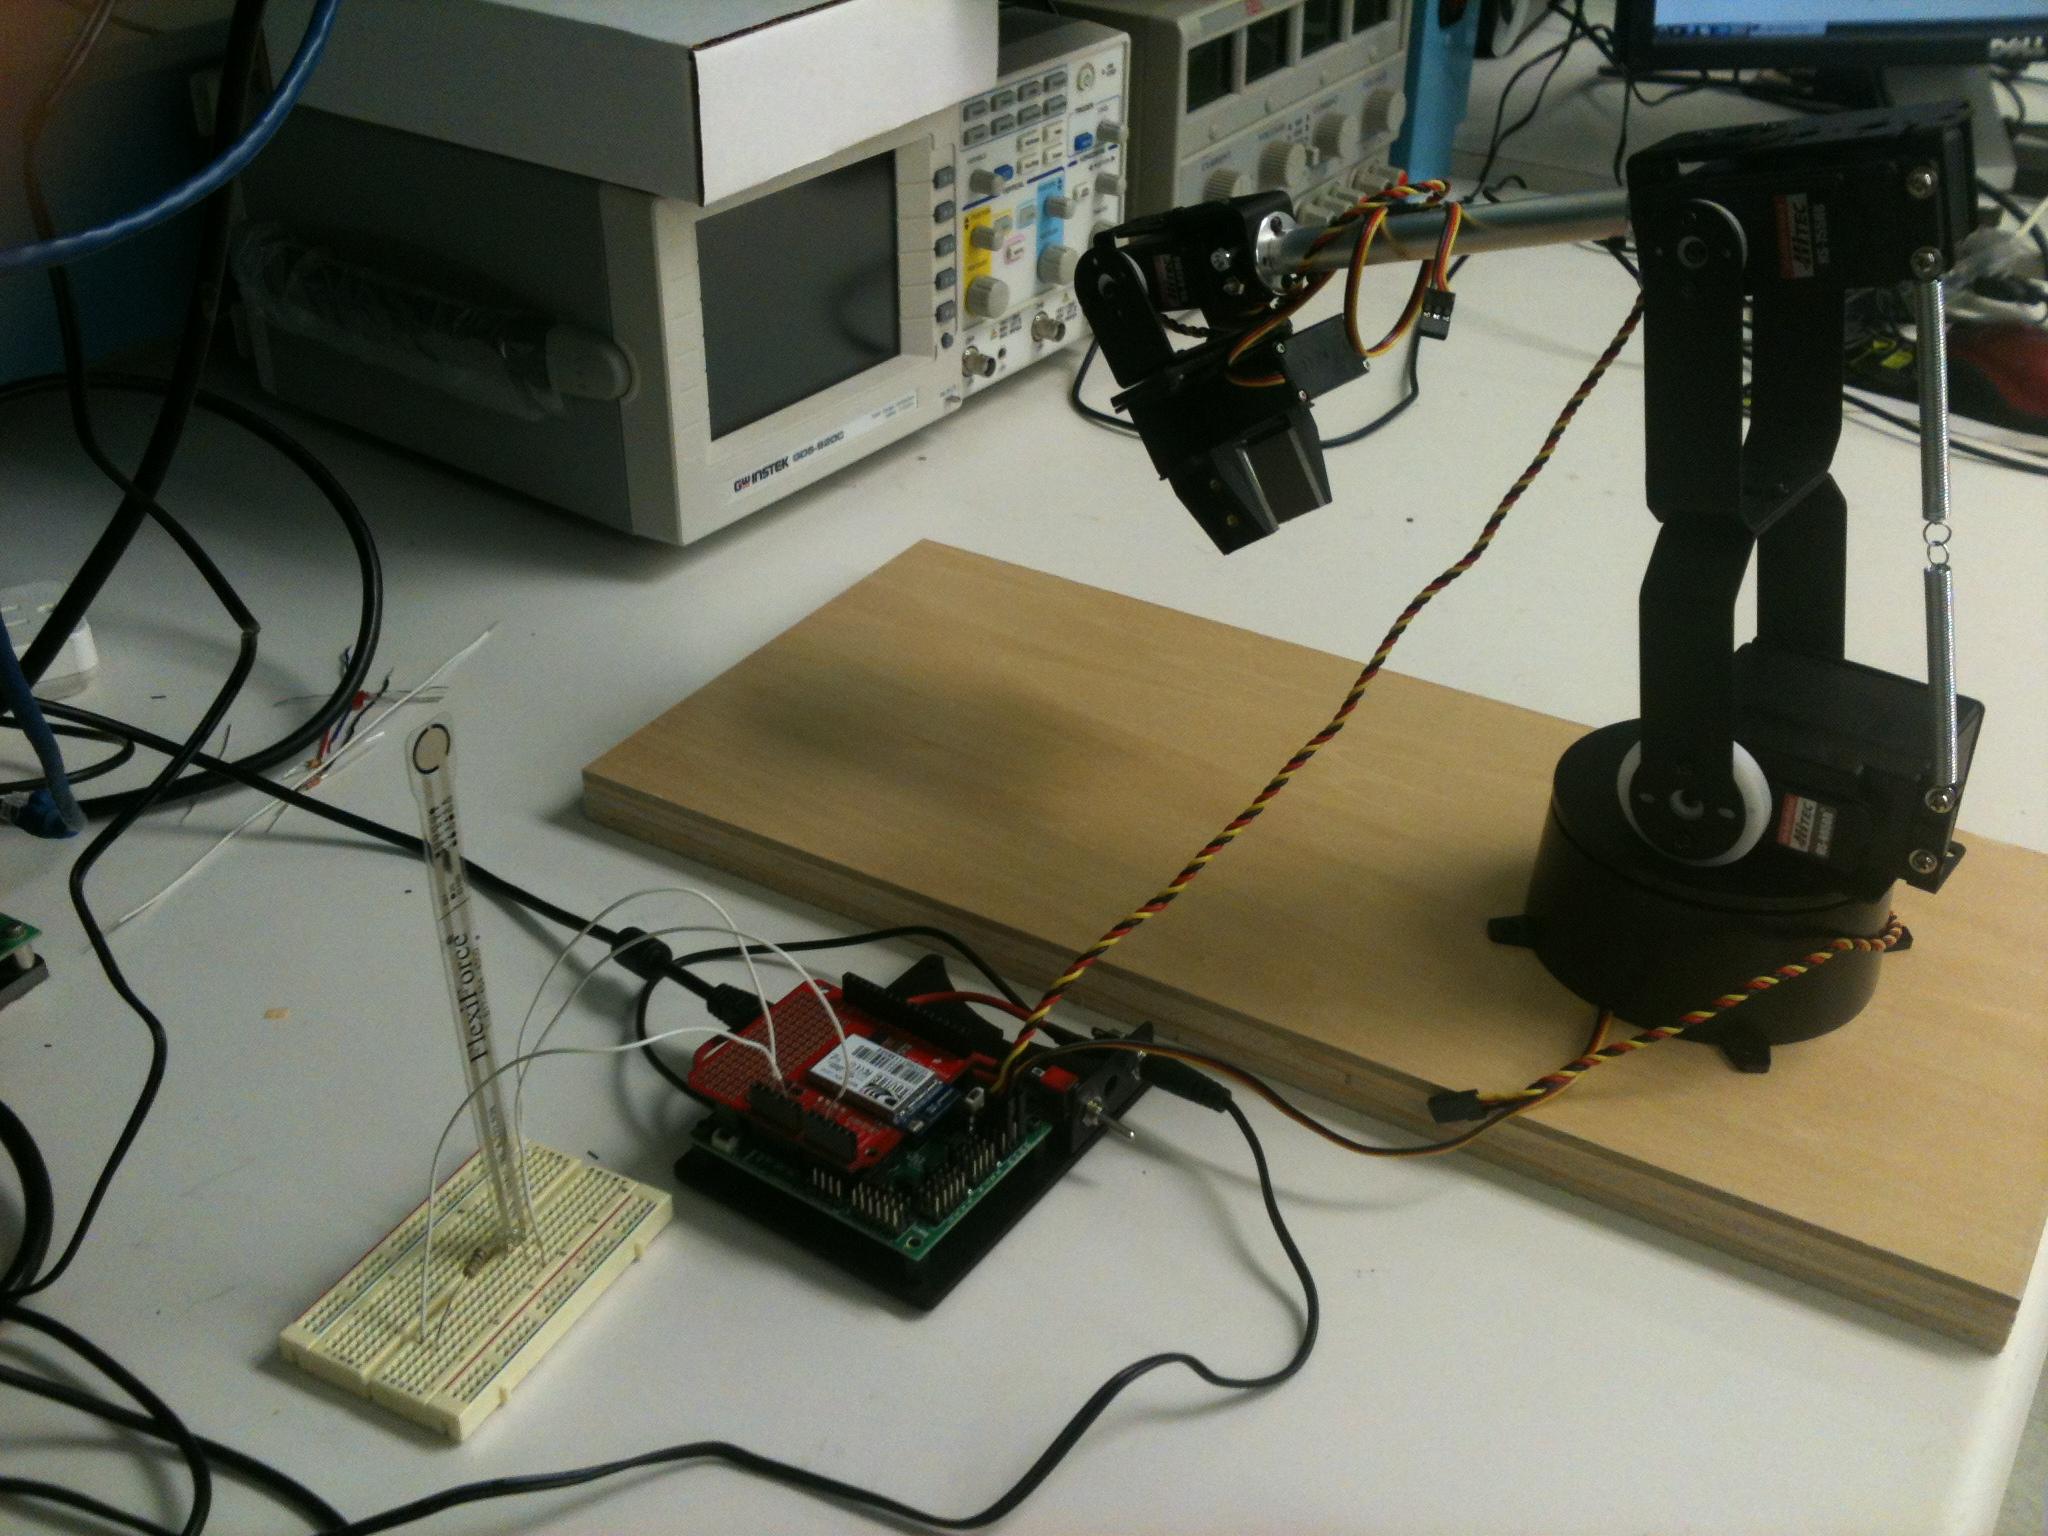
Our research concentrated on the design and development of the humanoid robot, Robot-Head. Numerous people are contributing to this project—some on the design, some on the hardware, and others on the software. Alexa worked with the team that is using 3D software and 3D printers to design Robot-Head’s body parts. Specifically, she researched on the design of Robot-Head’s neck, which will be biomimetic (mimic a human neck), however it will only have two degrees of freedom. Her research provided an overview of the human neck structure, other robotic neck designs, 3D software options, and the process for the development of current prototype of Robot-Head’s neck. Not only will Robot-Head’s neck imitate a human neck, it will eventually be covered with a synthetic skin with sensors to look and act more human like, which is unique to robots since other robots have necks with exposed motors, gears, and supports. Zulficar explored ways to securely use Android apps, java programming language, public-key and secret-key encryption/decryption, Arduino’s microcontroller, and the programming language used by Arduino to communicate and control robotic actions analogous to how sensory receptors in the human skin respond to the sensation of pain, heat, touch, pressure, vibration, and stress. Specifically, he evaluated a pressure sensor with a robotic arm. Eventually, his research will impact the use of synthetic skin and limb functionality of Robot-Head.
Robot-Head’s 3D designed neck mounted to the chest and head
Illustration of 3 DOF robotic manipulator
Lesson Plan
Title: Robotic Clock to Explore Equivalent Fractions
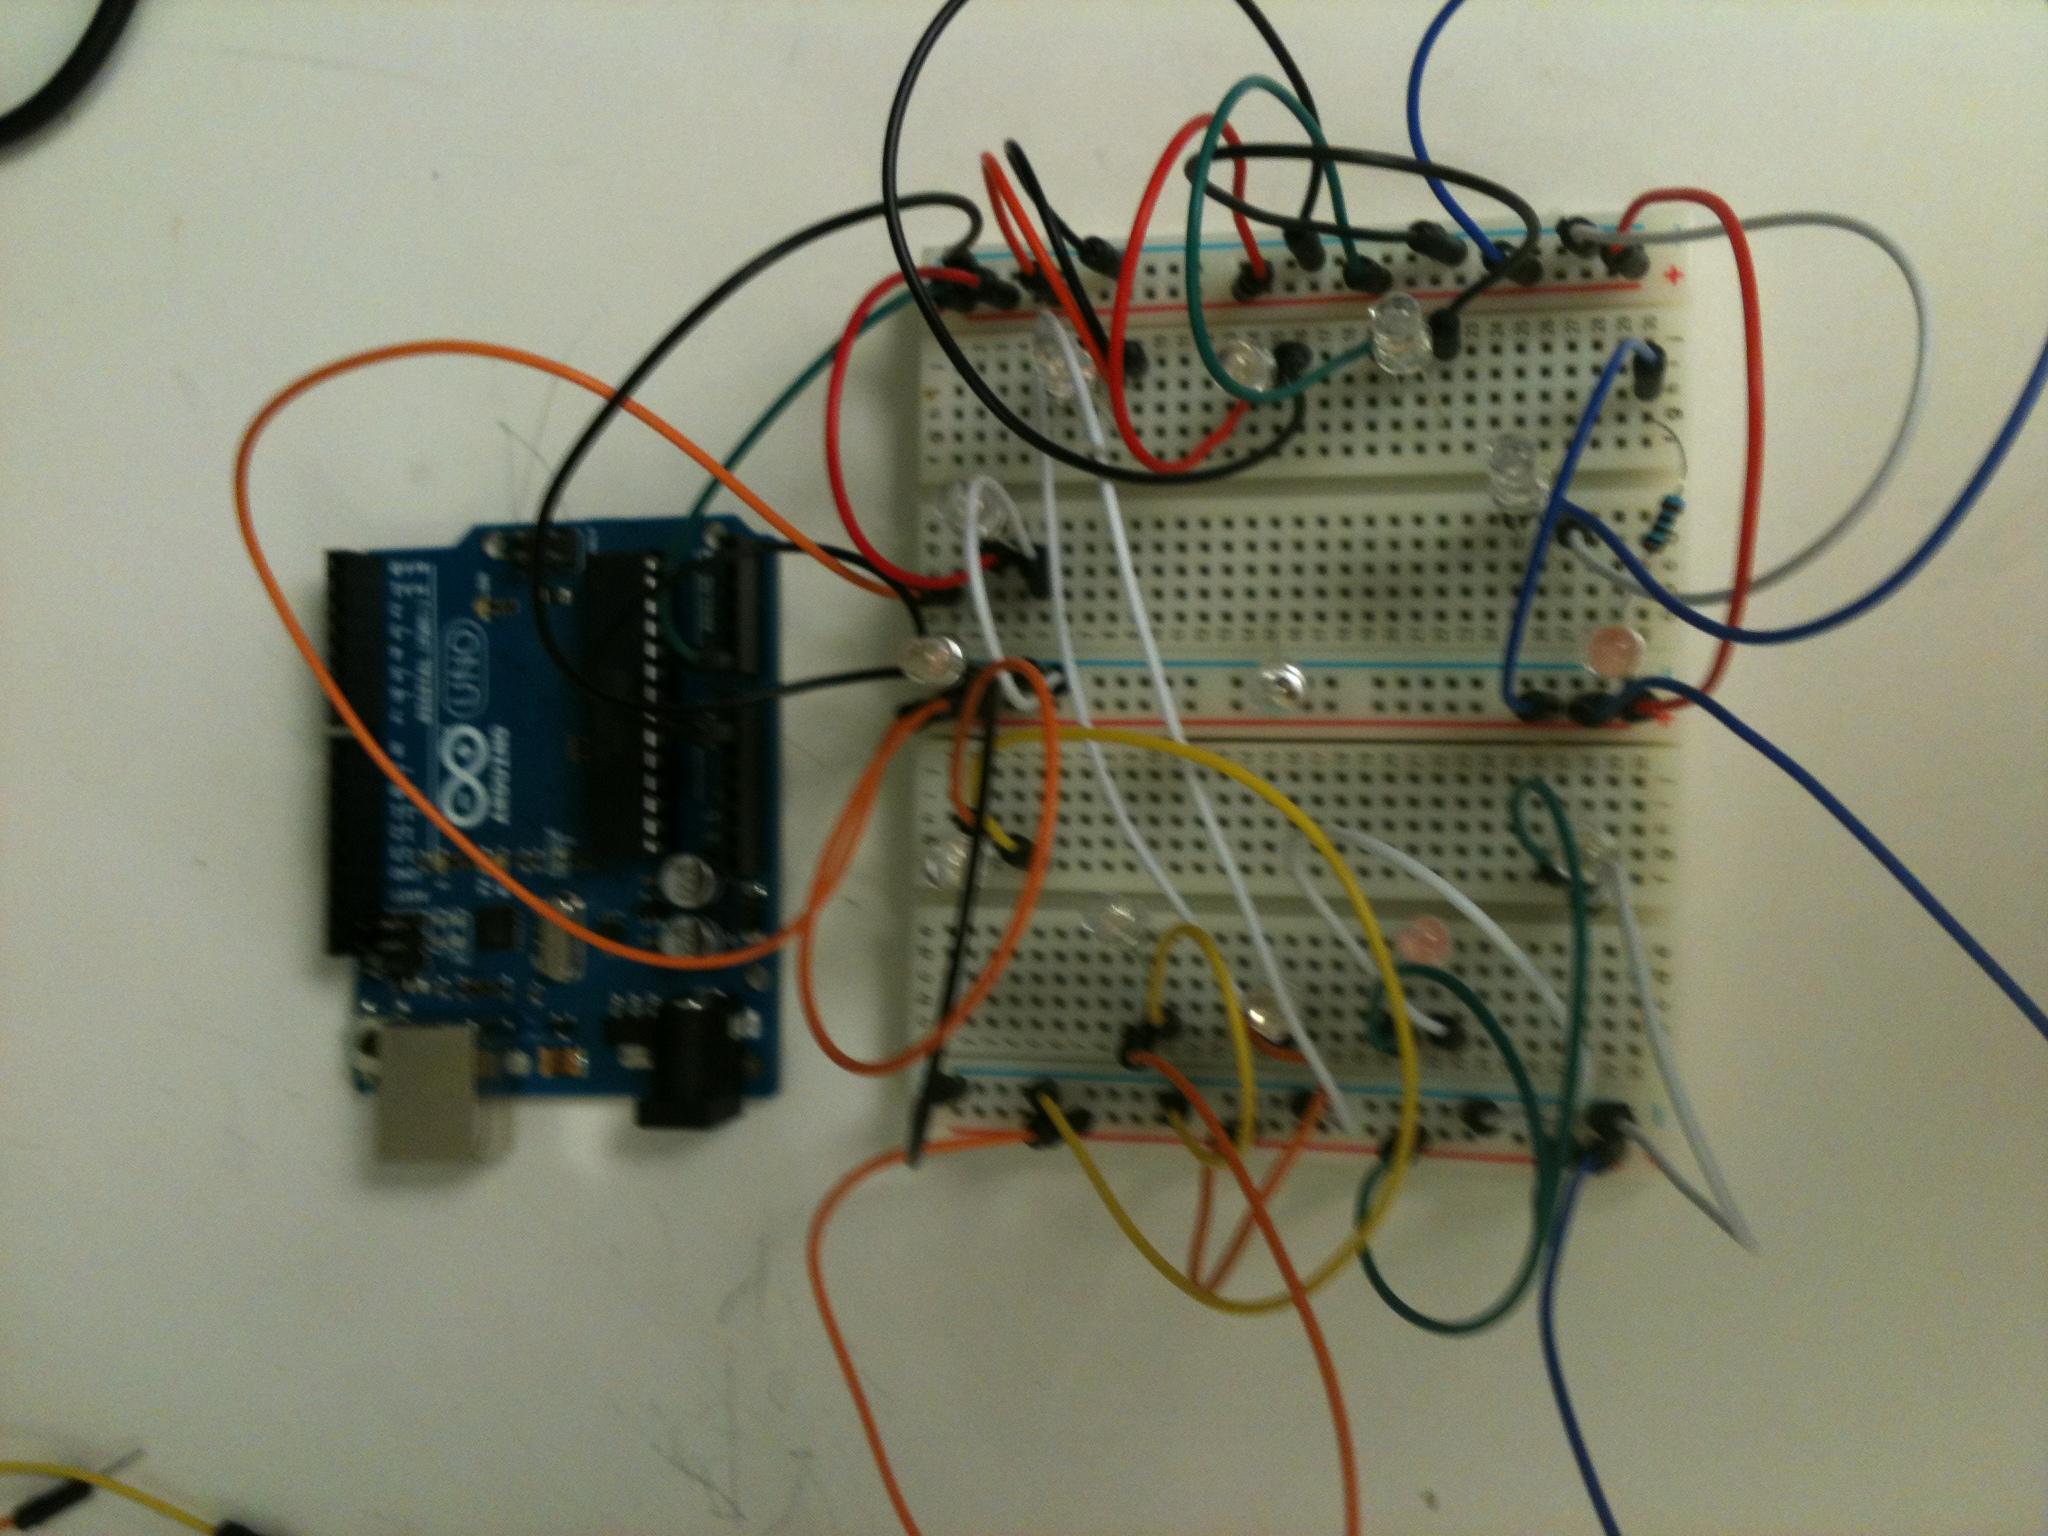
This lesson is aimed at students who are developing the basic understanding of equivalent fractions. A robotic clock that has LEDs at each hour is used to visually demonstrate different fractional values. The Arduino I/O board is programmed to turn on the LEDs based on the fractional input typed by the students. This allows students to see that some fractions are equivalent and gives them the opportunity to figure out why. If we input ¼ what LEDs go on? What other fractions could make the same set lights go on? Student will record all “equivalent” fractions on their graphic organizers. Then they will analyze the pattern of fraction equivalence and finally, they will write an explanation, about what equivalent fractions are and why do they work.
Prototype of equivalent fractions experimental testbed
Project 6: Development of an Air Quality Measurement Module for an Aquatic Mobile Robot
Channa Comer and Dwight Young
Research
Title: Development of an Air Quality Measurement Module for an Aquatic Mobile Robot
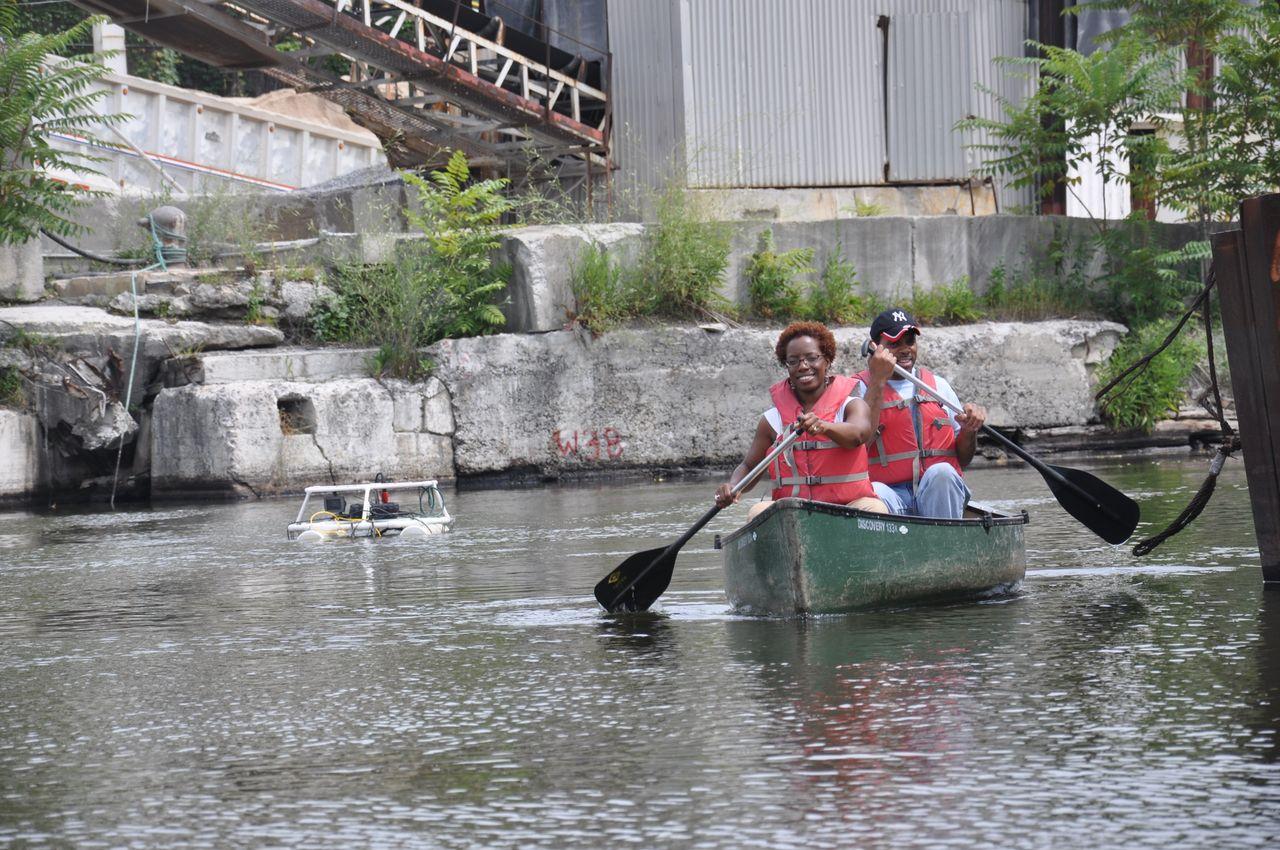
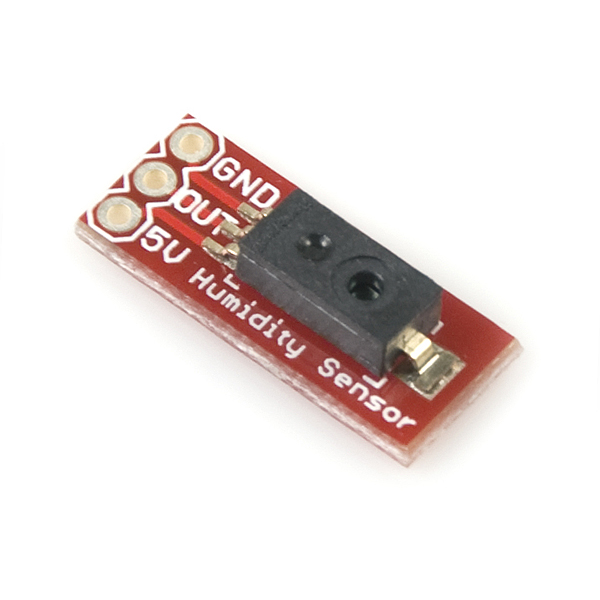
The Brooklyn Atlantis Project (the project) is a citizen science project which began in 2011. The objectives of the project are to: (1) develop a model which will enable members of the public to take part in scientific research through the combined use of machines and a web-based peer production system operated by volunteers, and (2) develop a cyber-human infrastructure for real-time monitoring and hazard detection of the natural environment. In the project, marine sensor units are mounted on an aquatic mobile robot (the robot). The robot is deployed into the Gowanus Canal in Brooklyn, NY, once each week to collect water quality data (dissolved oxygen, pH, water temperature, and conductivity) and take photographs both above and below water. Members of the public who wish to participate in the project assist with tagging images collected by the robot and have access to the water quality data. In this research project, we enhanced the environmental monitoring capabilities of the robot with the development of a module consisting of a sensor array to collect air quality data (Carbon monoxide/Volatile Organic Compounds (VOCs), Nitrogen Dioxide, Ozone) and associated weather data (humidity, temperature, barometric pressure).
Prototype sensor circuitry interfaced with an Arduino Uno and Channa and Dwight in a boat with ARV to their left in Gowanus Canal
Lesson Plan
Title: Sensing Weather
Mechanical and electrical engineers are involved in the design and building of weather instruments and their electrical components. Scientists use these instruments to collect weather data for forecasting and analyzing trends. All engineers use the engineering design process to create the best solutions to a given problem. In this two-part lesson, students will learn how sensors are used in weather instruments and how scientists use weather instruments to track weather. In the first part of the activity, students will assemble a simple temperature and humidity sensor with electronics circuitry and microcontrollers and use the design process to create a housing for their sensory system. In the second part of the activity, students will use their weather sensors to collect weather data over the course of seven days, display the data, and analyze the data to determine trends and relationships between weather factors.
